
Ranked: World’s Biggest Wine Producers by Country

Article/Editing:

Save to Inbox
Ranked: World’s Biggest Wine Producers By Country
“Wine gives a man fresh strength when he is wearied”—Homer, The Iliad
Wine has been in our cups, in our thoughts, and in our poems for many a millennia, from the antics of Dionysus, the Greek god of wine, to its symbolism in the Last Supper. But breaking down the biggest wine producers by country in the modern era leads to some interesting surprises.
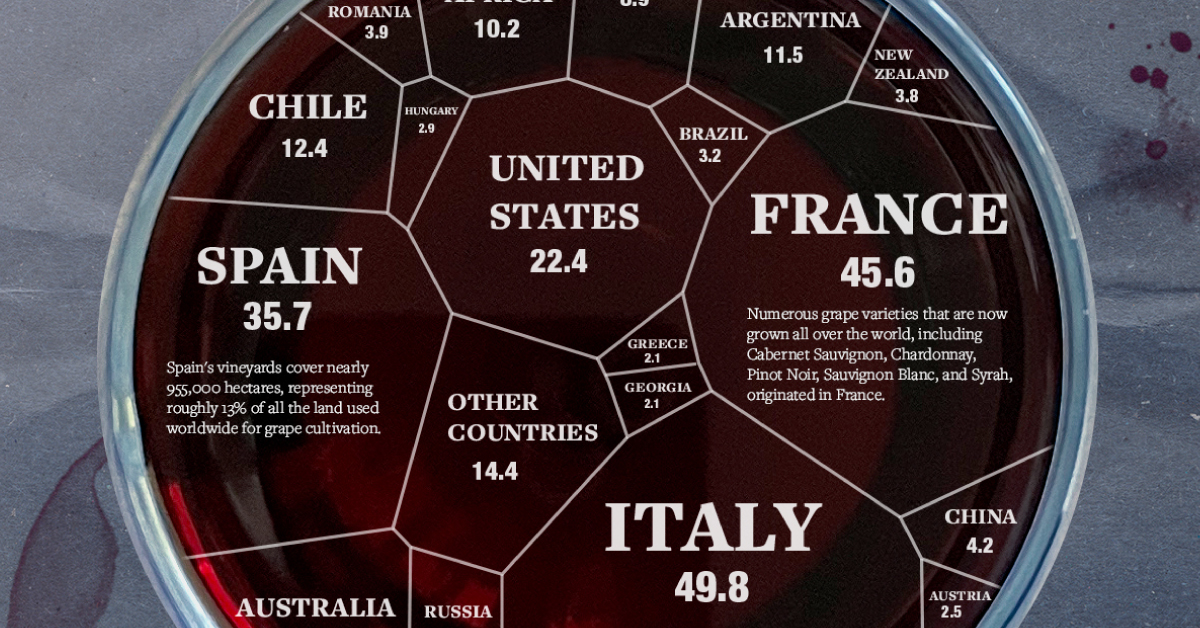
This infographic by Alberto Rojo Moro uses data from the International Organization of Vine and Wine (OIV) to visualize where wine production is concentrated in the world.
We take a quick look below.
The Top Wine Producers By Country in 2022
At the top of the list, Italy produced nearly 50 million hectoliters—or about 1,994 Olympic-sized swimming pools—of wine in 2022, accounting for nearly one-fifth of total production in the year. Less than half of that wine was sent to overseas markets, also making Italy the biggest exporter of the beverage by volume.
The country’s long coastline results in a moderate climate, allowing winemaking to occur in 20 different regions in Italy, with Veneto, Apulia, Emilia-Romagna, and Sicily leading in production.
Other known wine connoisseur countries—France (45.6 hectoliters) and Spain (35.8 million hectoliters)—rank second and third in wine production respectively. Together these three countries make up half of the world’s wine supply.
Here’s a full list of the world’s biggest wine producers by country.
| Rank | Country | Continent | Quantity (1,000 hl) | % of Total Production |
|---|---|---|---|---|
| 1 | 🇮🇹 Italy | Europe | 49,843 | 19.30% |
| 2 | 🇫🇷 France | Europe | 45,590 | 17.65% |
| 3 | 🇪🇸 Spain | Europe | 35,703 | 13.82% |
| 4 | 🇺🇸 U.S. | America | 22,385 | 8.67% |
| 5 | 🇦🇺 Australia | Oceania | 12,745 | 4.93% |
| 6 | 🇨🇱 Chile | America | 12,444 | 4.82% |
| 7 | 🇦🇷 Argentina | America | 11,451 | 4.43% |
| 8 | 🇿🇦 South Africa | Africa | 10,155 | 3.93% |
| 9 | 🇩🇪 Germany | Europe | 8,940 | 3.46% |
| 10 | 🇵🇹 Portugal | Europe | 6,777 | 2.62% |
| 11 | 🇷🇺 Russia | Europe | 4,700 | 1.82% |
| 12 | 🇨🇳 China | Asia | 4,182 | 1.62% |
| 13 | 🇳🇿 New Zealand | Oceania | 3,830 | 1.48% |
| 14 | 🇷🇴 Romania | Europe | 3,788 | 1.47% |
| 15 | 🇧🇷 Brazil | America | 3,200 | 1.24% |
| 16 | 🇭🇺 Hungary | Europe | 2,900 | 1.12% |
| 17 | 🇦🇹 Austria | Europe | 2,527 | 0.98% |
| 18 | 🇬🇪 Georgia | Europe | 2,135 | 0.83% |
| 19 | 🇬🇷 Greece | Europe | 2,127 | 0.82% |
| 20 | 🇲🇩 Moldova | Europe | 1,400 | 0.54% |
| 21 | 🇨🇭 Switzerland | Europe | 992 | 0.38% |
| 22 | 🇲🇰 North Macedonia | Europe | 936 | 0.36% |
| 23 | 🇯🇵 Japan | Asia | 830 | 0.32% |
| 24 | 🇵🇪 Peru | America | 810 | 0.31% |
| 25 | 🇺🇾 Uruguay | America | 756 | 0.29% |
| 26 | 🇧🇬 Bulgaria | Europe | 747 | 0.29% |
| 27 | 🇨🇦 Canada | America | 692 | 0.27% |
| 28 | 🇺🇦 Ukraine | Europe | 660 | 0.26% |
| 29 | 🇹🇷 Türkiye | Asia | 622 | 0.24% |
| 30 | 🇨🇿 Czech Republic | Europe | 586 | 0.23% |
| 31 | 🇭🇷 Croatia | Europe | 561 | 0.22% |
| 32 | 🇸🇮 Slovenia | Europe | 546 | 0.21% |
| 33 | 🇰🇿 Kazakhstan | Asia | 445 | 0.17% |
| 34 | 🇮🇱 Israel | Asia | 430 | 0.17% |
| 35 | 🇲🇦 Morocco | Africa | 418 | 0.16% |
| 36 | 🇹🇲 Turkmenistan | Asia | 400 | 0.15% |
| 37 | 🇲🇽 Mexico | America | 396 | 0.15% |
| 38 | 🇹🇳 Tunisia | Africa | 370 | 0.14% |
| 39 | 🇧🇾 Belarus | Europe | 340 | 0.13% |
| 40 | 🇸🇰 Slovakia | Europe | 334 | 0.13% |
| 41 | 🇦🇱 Albania | Europe | 228 | 0.09% |
| 42 | 🇺🇿 Uzbekistan | Asia | 216 | 0.08% |
| 43 | 🇩🇿 Algeria | Africa | 193 | 0.07% |
| 44 | 🇮🇳 India | Asia | 180 | 0.07% |
| 45 | 🇬🇧 UK | Europe | 91 | 0.04% |
| 46 | 🇱🇺 Luxembourg | Europe | 85 | 0.03% |
| 47 | 🇨🇾 Cyprus | Europe | 79 | 0.03% |
| 48 | 🇱🇹 Lithuania | Europe | 32 | 0.01% |
| 49 | 🇧🇪 Belgium | Europe | 30 | 0.01% |
| 50 | 🇲🇹 Malta | Europe | 13 | 0.01% |
| 51 | 🇳🇱 Netherlands | Europe | 10 | 0.00% |
| 52 | 🇵🇱 Poland | Europe | 5 | 0.00% |
| 53 | 🇩🇰 Denmark | Europe | 1 | 0.00% |
| 🌎 World | All | 258,265 | 100% |
Note: Percentages may not sum to 100% due to rounding.
The U.S., ranked 4th, is the top wine producer from the Americas, beating out other wine-producing countries like Chile (6th) and Argentina (7th).
South Africa, ranked 8th, is one of only four African countries in the dataset as winemaking isn’t as widespread on the continent as other regions in the world.
Meanwhile, China (ranked 12th) is the top wine producer from Asia. The region’s preference for other distilled spirits helps explain why the next two biggest Asian wine producers, Japan (23rd) and Türkiye (29th) occupy the middle ranks.
Unsurprisingly, European countries account for two-thirds of the world’s wine supply, followed by the Americas (20%) and then Oceania (6%).
Climate Concerns for Future Wine Production
Wine production has stayed relatively stable for the last decade but climate change is coming for this industry as well.
According to the New York Times, warmer temperatures are both a blessing and curse for winemakers. Some areas once deemed too inhospitable for grapevines (like England) are starting to show potential for certain varietals and wines. At the same time, in some traditional regions, prolonged warmer weather is leading to overripening, forcing winemakers to limit the grapes’ exposure to sunlight.
And the general weather anomalies caused by climate change—floods, droughts, wildfires—all make wine production just a little more difficult than it already is.
Which prompts a question worth pouring a glass of wine over to ponder: which wine producing countries will survive, adapt, languish or thrive in the coming decades?

This article was published as a part of Visual Capitalist's Creator Program, which features data-driven visuals from some of our favorite Creators around the world.


Ranked: The Countries That Dominate the Fertilizer Trade
Global agriculture depends on three main fertilizers. Four countries are responsible for over half of all fertilizer exports.


Who Leads the Global Fertilizer Trade?
Key Takeaways
- Russia is the world’s largest fertilizer exporter, shipping 23.2 million tonnes by nutrient content in 2024.
- Canada, China, Morocco, and Russia together account for 53% of global fertilizer exports.
- Mineral deposits and energy supplies help shape which countries lead the fertilizer trade.
The global food supply depends on a fertilizer trade concentrated among a relatively small group of countries.
Farmers use fertilizers to replenish nutrients and support crop growth. Producing them at scale depends heavily on access to key mineral deposits and energy resources.
This visualization ranks the world’s largest fertilizer exporters using the latest figures available (2024) from the Food and Agriculture Organization. It combines nitrogen, phosphate, and potash exports, measured by nutrient content rather than the full weight of fertilizer products.
The Big Four Fertilizer Exporters
Global fertilizer exports topped 113.3 million tonnes in 2024, with the four largest exporters accounting for more than half of the total.
Russia leads the ranking with 23.2 million tonnes, followed by Canada (14.4 million), Morocco (12.2 million), and China (10.1 million).
The table below ranks the world’s top fertilizer exporters in 2024 based on total tonnes exported.
| Rank | Country | 2024 fertilizer exports (tonnes) |
|---|---|---|
| 1 | 🇷🇺 Russia | 23,234,623 |
| 2 | 🇨🇦 Canada | 14,419,294 |
| 3 | 🇲🇦 Morocco | 12,154,362 |
| 4 | 🇨🇳 China | 10,126,069 |
| 5 | 🇺🇸 U.S. | 6,372,572 |
| 6 | 🇸🇦 Saudi Arabia | 5,589,139 |
| 7 | 🇩🇪 Germany | 3,136,446 |
| 8 | 🇮🇱 Israel | 2,782,901 |
| 9 | 🇶🇦 Qatar | 2,471,034 |
| 10 | 🇧🇾 Belarus | 2,436,719 |
| 11 | 🇳🇱 Netherlands | 2,244,415 |
| 12 | 🇪🇬 Egypt | 1,910,594 |
| 13 | 🇧🇪 Belgium | 1,830,168 |
| 14 | 🇩🇿 Algeria | 1,753,242 |
| 15 | 🇴🇲 Oman | 1,649,407 |
| 16 | 🇳🇴 Norway | 1,641,508 |
| 17 | 🇱🇦 Laos | 1,629,908 |
| 18 | 🇳🇬 Nigeria | 1,415,355 |
| 19 | 🇵🇱 Poland | 1,070,679 |
| 20 | 🇲🇾 Malaysia | 1,061,170 |
| 21 | 🇹🇲 Turkmenistan | 1,024,841 |
| 22 | 🇪🇸 Spain | 865,510 |
| 23 | 🇮🇩 Indonesia | 748,316 |
| 24 | 🇱🇹 Lithuania | 727,186 |
| 25 | 🇹🇹 Trinidad and Tobago | 689,636 |
| 26 | 🇻🇳 Vietnam | 610,681 |
| 27 | 🇨🇱 Chile | 601,601 |
| 28 | 🇹🇷 Türkiye | 513,686 |
| 29 | 🇧🇳 Brunei | 497,215 |
| 30 | 🇯🇴 Jordan | 433,747 |
| 31 | 🇧🇬 Bulgaria | 381,202 |
| 32 | 🇰🇷 South Korea | 374,965 |
| 33 | 🇸🇰 Slovakia | 360,260 |
| 34 | 🇺🇿 Uzbekistan | 359,536 |
| 35 | 🇧🇭 Bahrain | 318,528 |
| 36 | 🇫🇷 France | 301,235 |
| 37 | 🇮🇹 Italy | 297,626 |
| 38 | 🇻🇪 Venezuela | 276,721 |
| 39 | 🇦🇺 Australia | 271,208 |
| 40 | 🇬🇧 UK | 265,615 |
| 41 | 🇧🇴 Bolivia | 263,910 |
| 42 | 🇰🇿 Kazakhstan | 260,759 |
| 43 | 🇦🇿 Azerbaijan | 259,871 |
| 44 | 🇿🇦 South Africa | 254,092 |
| 45 | 🇬🇷 Greece | 245,335 |
| 46 | 🇹🇳 Tunisia | 223,833 |
| 47 | 🇧🇷 Brazil | 205,427 |
| 48 | 🇸🇪 Sweden | 201,946 |
| 49 | 🇹🇭 Thailand | 198,058 |
| 50 | 🇷🇸 Serbia | 184,174 |
| 51 | 🇵🇹 Portugal | 175,072 |
| 52 | 🇭🇺 Hungary | 174,732 |
| 53 | 🇮🇳 India | 155,111 |
| 54 | 🇨🇿 Czechia | 145,631 |
| 55 | 🇬🇪 Georgia | 131,526 |
| 56 | 🇹🇼 Taiwan | 124,326 |
| 57 | 🇲🇽 Mexico | 121,036 |
| 58 | 🇯🇵 Japan | 105,137 |
| 59 | 🇷🇴 Romania | 95,519 |
| 60 | 🇨🇮 Côte d'Ivoire | 94,742 |
| 61 | 🇭🇷 Croatia | 86,147 |
| 62 | 🇱🇻 Latvia | 64,310 |
| 63 | 🇸🇮 Slovenia | 59,726 |
| 64 | 🇱🇧 Lebanon | 59,118 |
| 65 | 🇫🇮 Finland | 51,017 |
| 66 | 🇨🇴 Colombia | 40,997 |
| 67 | 🇳🇦 Namibia | 40,182 |
| 68 | 🇭🇳 Honduras | 36,650 |
| 69 | 🇲🇿 Mozambique | 34,813 |
| 70 | 🇹🇿 Tanzania | 29,417 |
| 71 | 🇩🇰 Denmark | 29,249 |
| 72 | 🇸🇳 Senegal | 28,976 |
| 73 | 🇰🇪 Kenya | 28,094 |
| 74 | 🇩🇴 Dominican Republic | 22,095 |
| 75 | 🇵🇪 Peru | 21,757 |
| 76 | 🇦🇪 United Arab Emirates | 20,627 |
| 77 | 🇬🇹 Guatemala | 19,637 |
| 78 | 🇬🇭 Ghana | 19,325 |
| 79 | 🇵🇭 Philippines | 19,041 |
| 80 | 🇮🇷 Iran | 16,938 |
| 81 | 🇦🇹 Austria | 15,574 |
| 82 | 🇸🇬 Singapore | 15,198 |
| 83 | 🇮🇪 Ireland | 14,811 |
| 84 | 🇲🇬 Madagascar | 14,692 |
| 85 | 🇨🇷 Costa Rica | 13,587 |
| 86 | 🇺🇦 Ukraine | 13,291 |
| 87 | 🇲🇱 Mali | 13,089 |
| 88 | 🇱🇺 Luxembourg | 12,538 |
| 89 | 🇸🇻 El Salvador | 12,420 |
| 90 | 🇸🇿 Eswatini | 9,464 |
| 91 | 🇺🇾 Uruguay | 7,628 |
| 92 | 🇪🇪 Estonia | 6,768 |
| 93 | 🇵🇦 Panama | 4,340 |
| 94 | 🇬🇾 Guyana | 3,527 |
| 95 | 🇲🇰 North Macedonia | 2,869 |
| 96 | 🇪🇨 Ecuador | 1,585 |
| 97 | 🇧🇦 Bosnia and Herzegovina | 1,543 |
| 98 | 🇰🇵 North Korea | 1,265 |
| 99 | 🇭🇰 Hong Kong | 1,244 |
| 100 | 🇰🇼 Kuwait | 1,237 |
| 101 | 🇲🇼 Malawi | 1,000 |
| 102 | 🇵🇾 Paraguay | 972 |
| 103 | 🇧🇸 Bahamas | 884 |
| 104 | 🇸🇾 Syria | 612 |
| 105 | 🇦🇴 Angola | 583 |
| 106 | 🇮🇶 Iraq | 579 |
| 107 | 🇵🇰 Pakistan | 570 |
| 108 | 🇳🇿 New Zealand | 543 |
| 109 | 🇧🇫 Burkina Faso | 539 |
| 110 | 🇨🇲 Cameroon | 523 |
| 111 | 🇹🇯 Tajikistan | 450 |
| 112 | 🇱🇾 Libya | 349 |
| 113 | 🇺🇬 Uganda | 334 |
| 114 | 🇨🇭 Switzerland | 327 |
| 115 | 🇹🇬 Togo | 315 |
| 116 | 🇧🇼 Botswana | 233 |
| 117 | 🇲🇩 Moldova | 232 |
| 118 | 🇰🇬 Kyrgyzstan | 176 |
| 119 | 🇲🇺 Mauritius | 155 |
| 120 | 🇧🇩 Bangladesh | 131 |
| 121 | 🇦🇲 Armenia | 116 |
| 122 | 🇬🇲 Gambia | 101 |
| 123 | 🇧🇯 Benin | 54 |
| 124 | 🇯🇲 Jamaica | 42 |
| 125 | 🇦🇱 Albania | 36 |
| 126 | 🇱🇷 Liberia | 20 |
| 127 | 🇨🇬 Congo | 18 |
| 128 | 🇨🇾 Cyprus | 9 |
| 129 | 🇨🇩 DR Congo | 8 |
| 130 | 🇵🇸 Palestine | 8 |
| 131 | 🇨🇺 Cuba | 6 |
| 132 | 🇳🇪 Niger | 6 |
| 133 | 🇰🇭 Cambodia | 3 |
| 134 | 🇲🇪 Montenegro | 3 |
| 135 | 🇱🇰 Sri Lanka | 2 |
| 136 | 🇸🇷 Suriname | 1 |
| Total | 113,373,883 |
These totals combine different parts of the fertilizer industry, each supplying essential nutrients for agriculture. Potash supplies potassium, while phosphate fertilizers supply phosphorus. Nitrogen fertilizers follow a different production process.
As a result, strength in one fertilizer category does not necessarily translate to strength in another. The four leading exporters dominate different parts of the market.
Mining Potash and Phosphate
Canada’s position starts underground. Its potash industry draws on extensive deposits in Saskatchewan, giving the country an advantage that producers without comparable resources cannot easily replicate.
Canada supplies over 70% of the potash consumed in the United States. Efforts to replace Canadian supply with smaller producers, such as Belarus (2.4 million tonnes), therefore face significant logistical challenges.
Morocco, meanwhile, is a major producer of phosphate rock. State-owned OCP Group mines the resource and processes it into phosphoric acid and phosphate fertilizers. OCP alone holds over 30% of the global phosphate market, generating revenue of nearly $10 billion in 2024.
Energy-Intensive Nitrogen Production
For nitrogen fertilizer, the constraint is different. Nitrogen is abundant in the air, but converting it into ammonia, the starting point for mineral nitrogen fertilizers, requires substantial energy and a source of hydrogen.
Natural gas commonly provides both the fuel and the raw material needed to produce that hydrogen. Access to relatively low-cost gas has helped Russia, along with exporters such as Qatar (2.5 million tonnes) and the U.S. (6.4 million tonnes), expand ammonia production.
China, meanwhile, developed much of its ammonia industry around abundant coal supplies instead. The country produces more coal than the rest of the world combined.
Learn More on the Voronoi App
To see how one major market has maintained demand for fertilizer, check out EU Has Continued to Buy Russian Fertilizer Throughout War on Voronoi.
Where the U.S. Gets Its Potash From, by Country
The United States gets an overwhelming majority of its potash, an essential nutrient for agriculture, from just one country.


So, Where Does America Get Its Potash?
Key Takeaways
- Potash supplies potassium, an essential nutrient for growing crops.
- Nearly three-quarters (73%) of U.S. potash consumption comes from Canada.
- Domestic supply, primarily from New Mexico, covers just 8% of U.S. consumption.
The United States is one of the world’s largest agricultural economies. Growing those crops requires large amounts of fertilizer, including potassium-rich potash.
This visualization shows the largest sources of U.S. potash consumption using data from the U.S. Geological Survey (USGS) Mineral Commodities Summaries 2026.
Volumes are expressed in tonnes of potassium oxide equivalent (K₂O), a standard measure that allows different potash products to be compared by their potassium content.
Canada’s Natural Advantage
Canada accounts for 73% of U.S. potash consumption, supported by abundant mineral deposits and its proximity to American farms.
Canada is the world’s largest potash-producing country, with much of its mining industry concentrated in Saskatchewan. Beneath the province lie extensive salt deposits that support a major fertilizer export industry.
The table below shows the estimated breakdown of sources for U.S. potash consumption.
| Source | U.S. potash by source (K₂O equivalent, 2025) | Share |
|---|---|---|
| 🇨🇦 Canada | 4.31 Mt | 72.9% |
| 🇷🇺 Russia | 0.65 Mt | 11.0% |
| 🇺🇸 U.S. (domestic) | 0.47 Mt | 8.0% |
| 🇮🇱 Israel | 0.18 Mt | 3.0% |
| Other (foreign) | 0.30 Mt | 5.1% |
| Total | 5.91 Mt | 100.0% |
Established rail connections help move Canadian production south into the United States. Nutrien, a major Saskatchewan-based producer, ships potash across the U.S. through its North American transportation network.
That overland connection gives Canadian supply a logistical advantage over alternatives that require ocean transport.
Washington Looks to Belarus
In September 2026, U.S. President Donald Trump said Washington was working on a major agreement to purchase potash from Belarus at prices below those paid for Canadian supply. The following day, he said the U.S. would continue buying Canadian potash while also pursuing the possibility of lower-priced Belarusian supply.
Potash has been excluded from the additional Section 338 tariffs imposed on certain Canadian goods, underscoring its importance to U.S. agriculture.
However, adding Belarusian supply would involve more than finding another producer. Landlocked Belarus faces restrictions on European export routes and relies heavily on Russian transportation infrastructure. It also has existing customers, including China, Brazil, and India, limiting how much production could readily be redirected.
Transportation costs are another consideration. Unlike Canadian potash, which can move overland into the U.S., Belarusian supply would face a longer and more complex journey. That means a lower purchase price would not necessarily translate into lower delivered costs for American buyers.
What It Means for American Farmers
For farmers, the practical question is whether alternative suppliers can deliver affordable fertilizer when it is needed. Potassium helps plants regulate water use, develop roots, and withstand drought. When available potassium is insufficient, plant growth and yields can suffer.
Farmers can use soil testing to determine how much potash to apply. Nitrogen and phosphorus cannot replace potassium’s role in crop development, so cheaper supplies of other fertilizers do not remove the need for it.
Other suppliers, including Russia at 11% and Israel at 3%, already provide some diversification. Whether additional Belarusian supply ultimately lowers costs will depend on the final terms, available volumes, and transportation expenses.
Learn More on the Voronoi App
See which countries have the most arable land in this visualization on Voronoi.
-
 Countries3 weeks ago
Ranked: The World’s Best Countries at Math in 2026
-
Debt2 weeks ago
Ranked: Countries With the Most Government Debt Per Person
-
Jobs2 weeks ago
Mapped: The Best Employer in Every U.S. State
-
Maps6 days ago
Mapped: Every State’s Signature Ice Cream Flavor
-
GDP1 week ago
Ranked: The World’s Most and Least Taxed Countries
-
Economy4 days ago
Ranked: The World’s Richest Countries (2006-2026)
-
Economy3 weeks ago
Ranked: The World’s Strongest City Economies by 2050
-
Cost of Living2 days ago
Ranked: The World’s Best Cities for Quality of Life in 2026


