
Ranked: The 100 Most Spoken Languages Around the World

Save to Inbox
Ranked: The 100 Most Spoken Languages Worldwide
Even though you’re reading this article in English, there’s a good chance it might not be your mother tongue. Of the billion-strong English speakers in the world, only 33% consider it their native language.
The popularity of a language depends greatly on utility and geographic location. Additionally, how we measure the spread of world languages can vary greatly depending on whether you look at total speakers or native speakers.
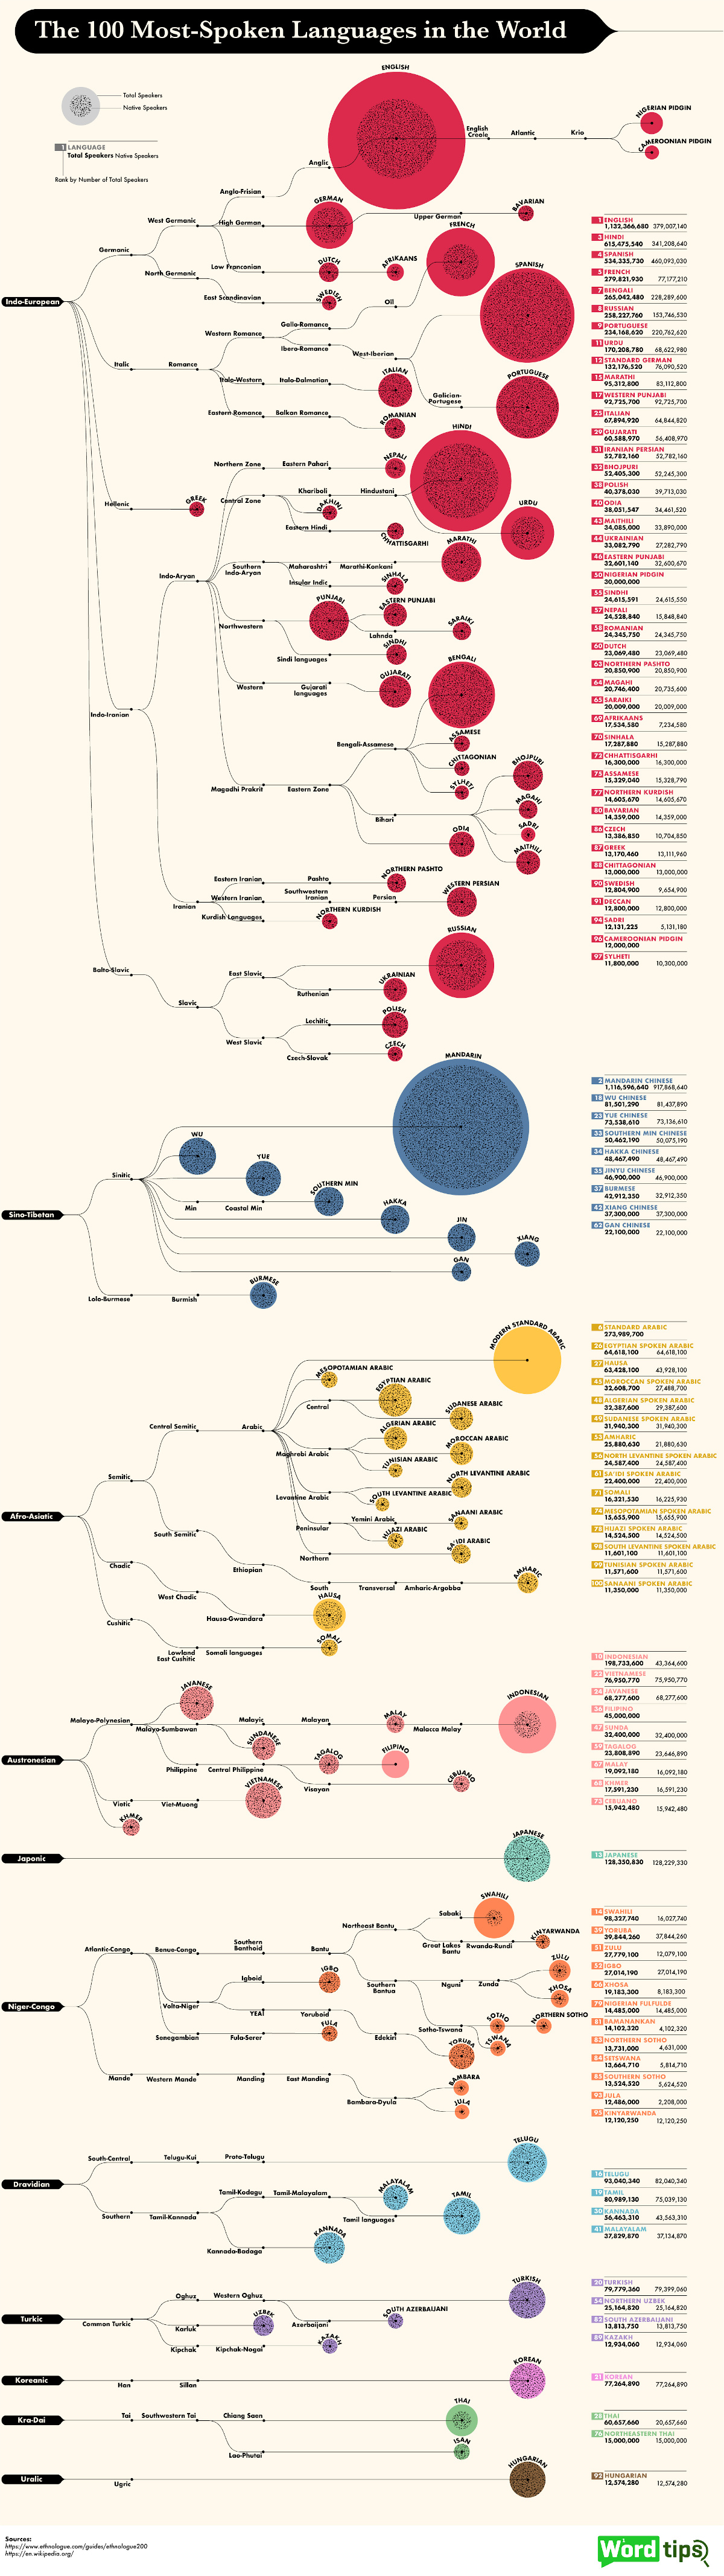
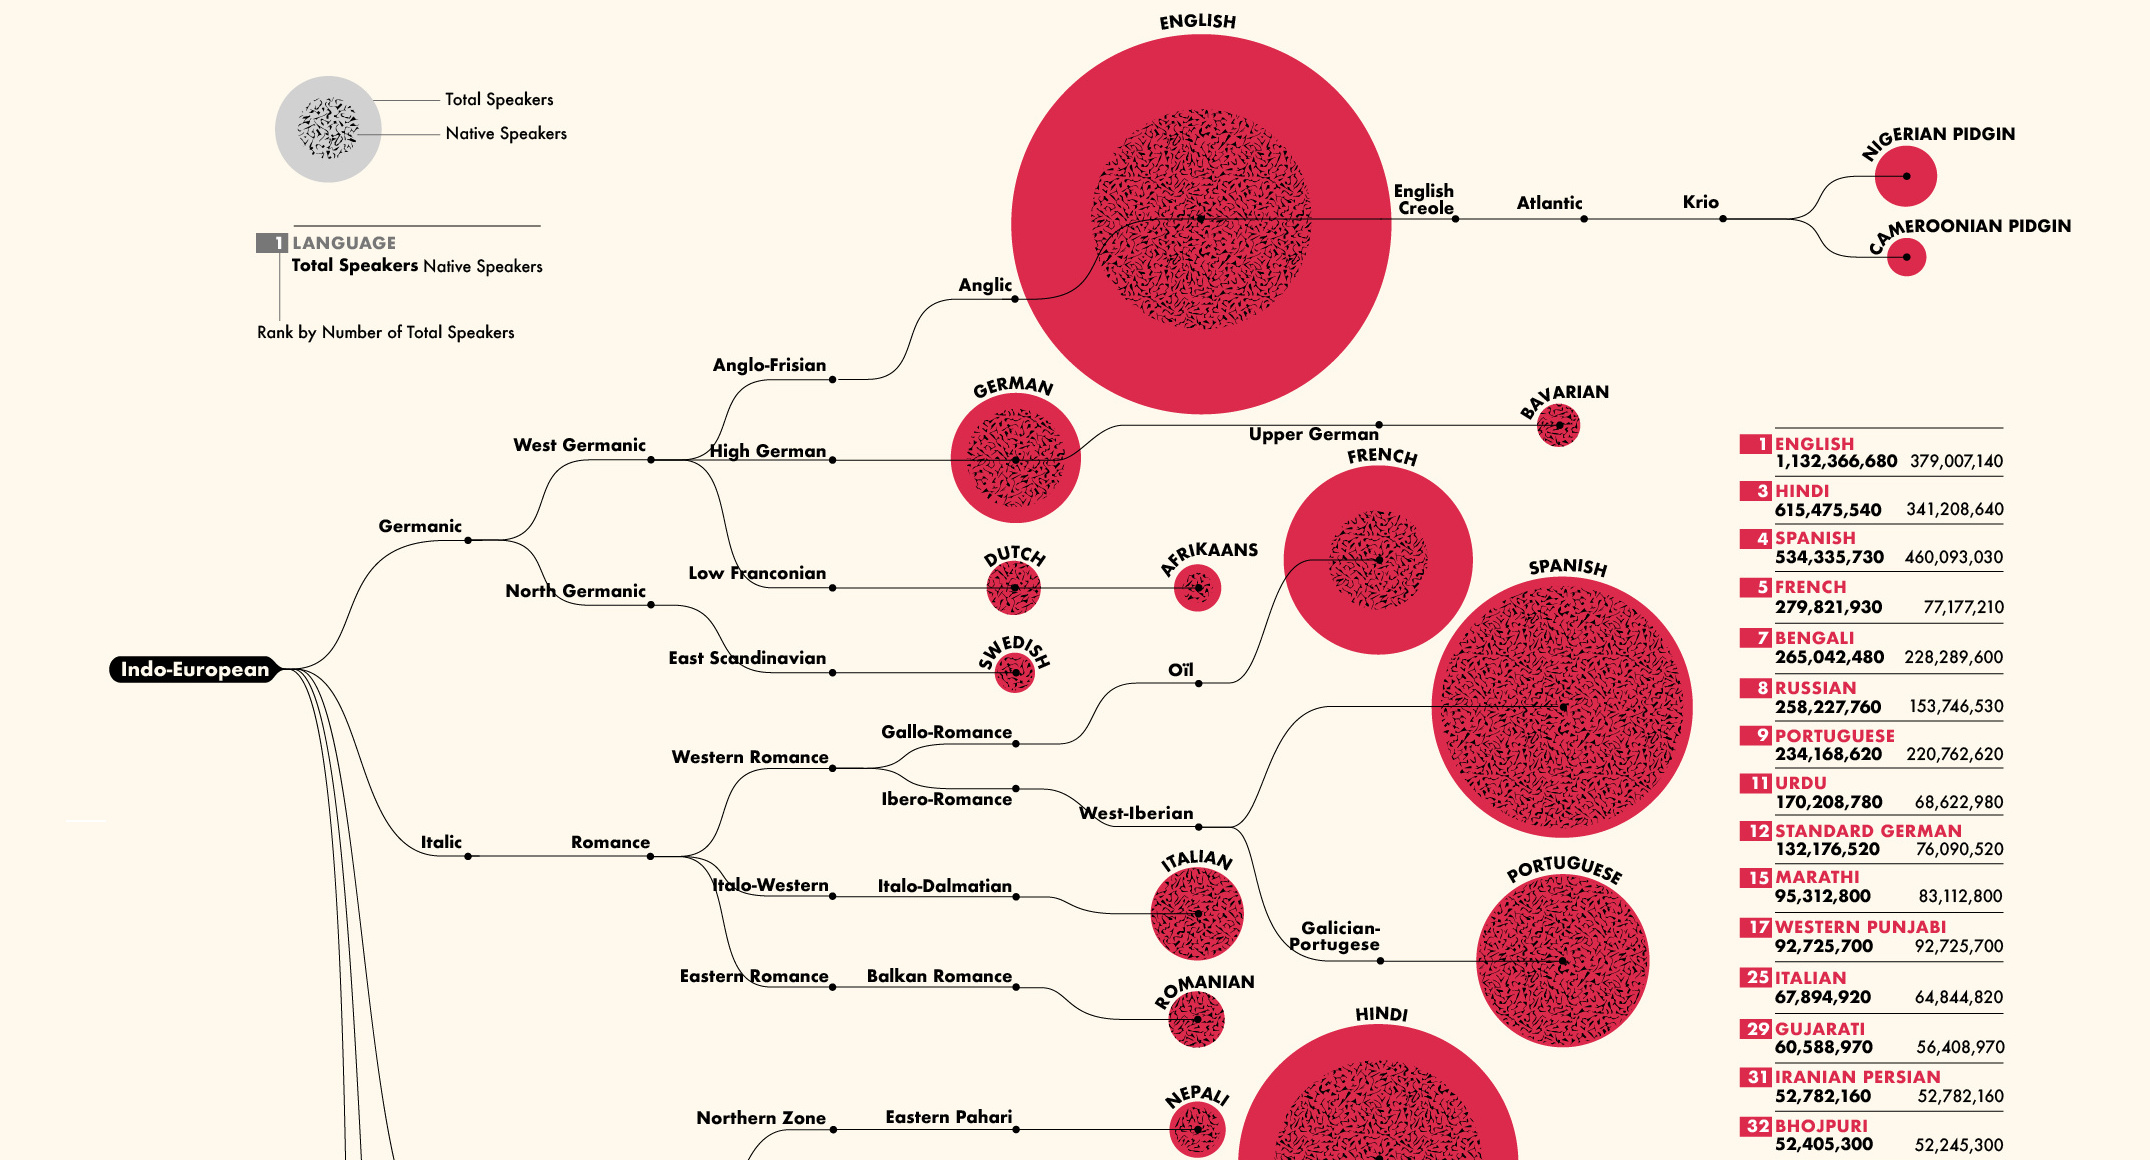
Today’s detailed visualization from WordTips illustrates the 100 most spoken languages in the world, the number of native speakers for each language, and the origin tree that each language has branched out from.
How Do You Define A Language?
The data comes from the 22nd edition of Ethnologue, a database covering a majority of the world’s population, detailing approximately 7,111 living languages in existence today.
The definitions of languages are often dynamic, blurring the lines around a singular understanding of what makes a language:
- Linguistic: focused on lexical and grammatical differences, or on variations within speech communities
- Social: focused on cultural or political factors, as well as heritage and identity
For the purposes of measurement, the researchers use the ISO 693-3 set of criteria, which accounts for related varieties and dialects—ensuring that linguistics are not the only factor considered in this count of languages.
Here are the language origins of the 100 most spoken languages:
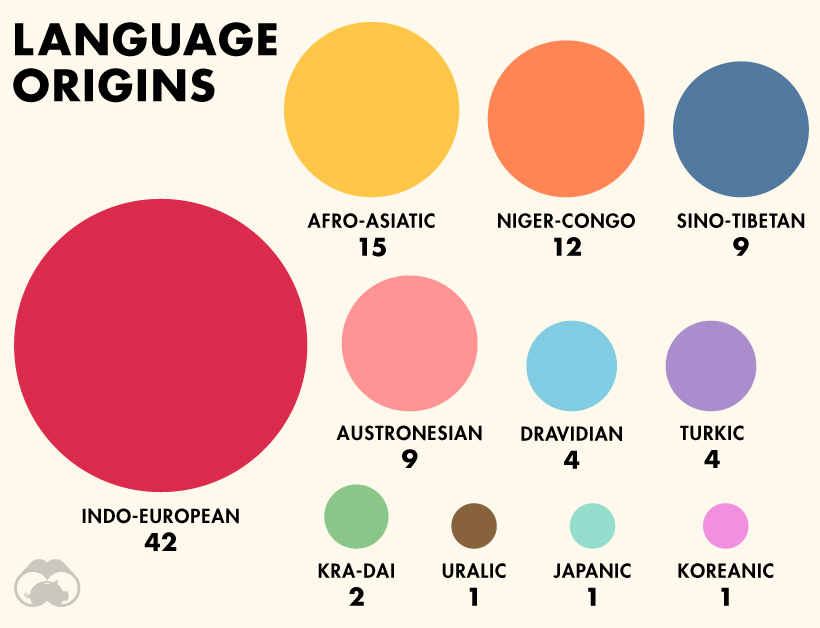
Indo-European languages have the widest spread worldwide. According to Ethnologue, the language family contains over 3 billion speakers in total. Interestingly, there are actually 1,526 Niger-Congo languages altogether, though only 12 are represented here.
Let’s now dive into the top 10 most spoken languages overall.
Which Languages Have the Most Speakers?
It comes as no surprise that English reigns supreme, with over 1.1 billion total speakers—or roughly 15% of the global population. Mandarin Chinese, Hindi, Spanish, and French round out the top five.
| Rank | Language | Total Speakers | Language Origin |
|---|---|---|---|
| 1 | English | 1,132 million | Indo-European |
| 2 | Mandarin Chinese | 1,117 million | Sino-Tibetan |
| 3 | Hindi | 615 million | Indo-European |
| 4 | Spanish | 534 million | Indo-European |
| 5 | French | 280 million | Indo-European |
| 6 | Standard Arabic | 274 million | Afro-Asiatic |
| 7 | Bengali | 265 million | Indo-European |
| 8 | Russian | 258 million | Indo-European |
| 9 | Portuguese | 234 million | Indo-European |
| 10 | Indonesian | 199 million | Austronesian |
However, this is only one piece in the full fabric of languages.
The metrics for native speakers tell a slightly different tale, as Mandarin Chinese shoots up to 918 million—almost 2.5x that of English native speakers.
| Rank | Language | Native Speakers | Language Origin |
|---|---|---|---|
| 1 | Mandarin Chinese | 918 million | Sino-Tibetan |
| 2 | Spanish | 460 million | Indo-European |
| 3 | English | 379 million | Indo-European |
| 4 | Hindi | 341 million | Indo-European |
| 5 | Bengali | 228 million | Indo-European |
| 6 | Portuguese | 221 million | Indo-European |
| 7 | Russian | 154 million | Indo-European |
| 8 | Japanese | 128 million | Japanic |
| 9 | Western Punjabi | 93 million | Indo-European |
| 10 | Marathi | 83 million | Indo-European |
Note: No native speaker data was available for Filipino, Standard Arabic, Nigerian Pidgin, or Cameroonian Pidgin.
Here, Spanish comes in strong second for native speakers with 460 million, considering it’s well-used across Latin America. The Indian languages of Hindi and Bengali cap off the top five by native speakers as well.
These are the biggest languages people learn growing up, but what about the ones they pick up later in life?
What About Second (L2) Languages?
Nearly 43% of the world’s population is bilingual, with the ability to switch between two languages with ease.
From the data, second language (L2) speakers can be calculated by looking at the difference between native and total speakers, as a proportion of the total. For example, 66% of English speakers learned it as a second language.
Swahili surprisingly has the highest ratio of L2 speakers to total speakers—although it only has 16 million native speakers, this shoots up to 98 million total speakers. Overall, 82% of Swahili speakers know it as a second language.
Swahili is listed as a national or official language in several African countries: Tanzania, Kenya, Uganda, and the Democratic Republic of Congo. It’s likely that the movement of people from rural areas into big cities in search of better economic opportunities, is what’s boosting the adoption of Swahili as a second language.
Indonesian is another similar example. With a 78% proportion of L2 speakers compared to total speakers, this variation on the Malay language has been used as the lingua franca across the islands for a long time. In contrast, only 17% of Mandarin speakers know it as a second language, perhaps because it is one of the most challenging languages to learn.
Keeping Language Traditions Alive
Languages are fluid, and constantly evolving—altogether, the 100 most spoken languages paint a unique picture across centuries of a changing world. Here’s the full list of these languages, by types of speakers and language origin.
| Rank | Language | Total Speakers | Native Speakers | Origin |
|---|---|---|---|---|
| 1 | English | 1,132M | 379M | Indo-European |
| 2 | Mandarin Chinese | 1,117M | 918M | Sino-Tibetan |
| 3 | Hindi | 615M | 341M | Indo-European |
| 4 | Spanish | 534M | 460M | Indo-European |
| 5 | French | 280M | 77M | Indo-European |
| 6 | Standard Arabic | 274M | NA | Afro-Asiatic |
| 7 | Bengali | 265M | 228M | Indo-European |
| 8 | Russian | 258M | 154M | Indo-European |
| 9 | Portuguese | 234M | 221M | Indo-European |
| 10 | Indonesian | 199M | 43M | Austronesian |
| 11 | Urdu | 170M | 69M | Indo-European |
| 12 | Standard German | 132M | 76M | Indo-European |
| 13 | Japanese | 128M | 128M | Japanic |
| 14 | Swahili | 98M | 16M | Niger-Congo |
| 15 | Marathi | 95M | 83M | Indo-European |
| 16 | Telugu | 93M | 82M | Dravidian |
| 17 | Western Punjabi | 93M | 93M | Indo-European |
| 18 | Wu Chinese | 82M | 81M | Sino-Tibetan |
| 19 | Tamil | 81M | 75M | Dravidian |
| 20 | Turkish | 80M | 69M | Turkic |
| 21 | Korean | 77M | 77M | Koreanic |
| 22 | Vietnamese | 77M | 76M | Austronesian |
| 23 | Yue Chinese | 74M | 73M | Sino-Tibetan |
| 24 | Javanese | 68M | 68M | Austronesian |
| 25 | Italian | 68M | 65M | Indo-European |
| 26 | Egyptian Spoken Arabic | 65M | 65M | Afro-Asiatic |
| 27 | Hausa | 63M | 44M | Afro-Asiatic |
| 28 | Thai | 61M | 21M | Kra-Dai |
| 29 | Gujarati | 61M | 56M | Indo-European |
| 30 | Kannada | 56M | 44M | Dravidian |
| 31 | Iranian Persian | 53M | 53M | Indo-European |
| 32 | Bhojpuri | 52M | 52M | Indo-European |
| 33 | Southern Min Chinese | 50M | 50M | Sino-Tibetan |
| 34 | Hakka Chinese | 48M | 48M | Sino-Tibetan |
| 35 | Jinyu Chinese | 47M | 47M | Sino-Tibetan |
| 36 | Filipino | 45M | NA | Austronesian |
| 37 | Burmese | 43M | 33M | Sino-Tibetan |
| 38 | Polish | 40M | 40M | Indo-European |
| 39 | Yoruba | 40M | 38M | Niger-Congo |
| 40 | Odia | 38M | 34M | Indo-European |
| 41 | Malayalam | 38M | 37M | Dravidian |
| 42 | Xiang Chinese | 37M | 37M | Sino-Tibetan |
| 43 | Maithili | 34M | 34M | Indo-European |
| 44 | Ukrainian | 33M | 27M | Indo-European |
| 45 | Moroccan Spoken Arabic | 33M | 27M | Afro-Asiatic |
| 46 | Eastern Punjabi | 33M | 33M | Indo-European |
| 47 | Sunda | 32M | 32M | Austronesian |
| 48 | Algerian Spoken Arabic | 32M | 29M | Afro-Asiatic |
| 49 | Sudanese Spoken Arabic | 32M | 32M | Afro-Asiatic |
| 50 | Nigerian Pidgin | 30M | NA | Indo-European |
| 51 | Zulu | 28M | 12M | Niger-Congo |
| 52 | Igbo | 27M | 27M | Niger-Congo |
| 53 | Amharic | 26M | 22M | Afro-Asiatic |
| 54 | Northern Uzbek | 25M | 25M | Turkic |
| 55 | Sindhi | 25M | 25M | Indo-European |
| 56 | North Levantine Spoken Arabic | 25M | 25M | Afro-Asiatic |
| 57 | Nepali | 25M | 16M | Indo-European |
| 58 | Romanian | 24M | 24M | Indo-European |
| 59 | Tagalog | 24M | 24M | Austronesian |
| 60 | Dutch | 23M | 23M | Indo-European |
| 61 | Sa'idi Spoken Arabic | 22M | 22M | Afro-Asiatic |
| 62 | Gan Chinese | 22M | 22M | Sino-Tibetan |
| 63 | Northern Pashto | 21M | 21M | Indo-European |
| 64 | Magahi | 21M | 21M | Indo-European |
| 65 | Saraiki | 20M | 20M | Indo-European |
| 66 | Xhosa | 19M | 8M | Niger-Congo |
| 67 | Malay | 19M | 16M | Austronesian |
| 68 | Khmer | 18M | 17M | Austronesian |
| 69 | Afrikaans | 18M | 7M | Indo-European |
| 70 | Sinhala | 17M | 15M | Indo-European |
| 71 | Somali | 16M | 16M | Afro-Asiatic |
| 72 | Chhattisgarhi | 16M | 16M | Indo-European |
| 73 | Cebuano | 16M | 16M | Austronesian |
| 74 | Mesopotamian Spoken Arabic | 16M | 16M | Afro-Asiatic |
| 75 | Assamese | 15M | 15M | Indo-European |
| 76 | Northeastern Thai | 15M | 15M | Kra-Dai |
| 77 | Northern Kurdish | 15M | 15M | Indo-European |
| 78 | Hijazi Spoken Arabic | 15M | 15M | Afro-Asiatic |
| 79 | Nigerian Fulfulde | 14M | 14M | Niger-Congo |
| 80 | Bavarian | 14M | 14M | Indo-European |
| 81 | Bamanankan | 14M | 4M | Niger-Congo |
| 82 | South Azerbaijani | 14M | 14M | Turkic |
| 83 | Northern Sotho | 14M | 5M | Niger-Congo |
| 84 | Setswana | 14M | 6M | Niger-Congo |
| 85 | Souther Sotho | 14M | 6M | Niger-Congo |
| 86 | Czech | 13M | 11M | Indo-European |
| 87 | Greek | 13M | 13M | Indo-European |
| 88 | Chittagonian | 13M | 13M | Indo-European |
| 89 | Kazakh | 13M | 13M | Turkic |
| 90 | Swedish | 13M | 10M | Indo-European |
| 91 | Deccan | 13M | 13M | Indo-European |
| 92 | Hungarian | 13M | 13M | Uralic |
| 93 | Jula | 12M | 2M | Niger-Congo |
| 94 | Sadri | 12M | 5M | Indo-European |
| 95 | Kinyarwanda | 12M | 12M | Niger-Congo |
| 96 | Cameroonian Pidgin | 12M | NA | Indo-European |
| 97 | Sylheti | 12M | 10M | Indo-European |
| 98 | South Levantine Spoken Arabic | 12M | 12M | Afro-Asiatic |
| 99 | Tunisian Spoken Arabic | 12M | 12M | Afro-Asiatic |
| 100 | Sanaani Spoken Arabic | 11M | 11M | Afro-Asiatic |
One reason these languages are popular is that they are actively and consistently used. Unfortunately, nearly 3,000 (about 40%) of all languages are at risk of being lost, or are already in the process of dying out today.
Languages play a crucial role in our daily lives. … [Their] losses have huge negative impacts indigenous peoples’ most basic human rights.
—UN, IYoIL statement
As a result, the United Nations declared 2019 the International Year of Indigenous Languages (IYoIL), with a resolution to continue fostering these languages and pass on their knowledge for future generations.


Mapped: The Most Walkable Cities in the U.S. & Canada
San Francisco narrowly beats New York as the most walkable large city in the U.S. and Canada, while 90 of 130 cities remain car-dependent.


Which Cities in the U.S. and Canada Are the Most Walkable?
Key Takeaways
- San Francisco’s walkability score (88.7 out of 100) edges out New York (88.0) as the most walkable city in the U.S. and Canada.
- Jersey City ranks third (86.6), ahead of Boston (82.8), and is one of seven smaller cities in major metropolitan areas to make the top 20.
- Six of the 20 most walkable cities are in the Northeast and five are in California. Vancouver is the only Canadian city in the top 20.
Being able to walk to a grocery store, pharmacy, or café without getting in a car is an important consideration for many people choosing where to live.
But walkability depends on more than pedestrian-friendly streets. City boundaries also play a major role, helping explain why some smaller cities outperform much larger neighbors.
This map shows the 20 most walkable of the 130 U.S. and Canadian cities with at least 200,000 residents, using Walk Score’s 2021 city ranking, the latest it has published. Scores range from 0 to 100 and reflect proximity to everyday amenities, population density, and pedestrian-friendly infrastructure.
Compact Cities Are the Most Walkable in the U.S. and Canada
Even the highest-ranked cities fall short of Walk Score’s 90-point threshold for a “Walker’s Paradise,” where daily errands don’t require a car.
All eight Northeastern cities in the 130-city ranking score above 50, averaging 74.7, and six make the top 20: New York, Jersey City, Boston, Newark, Philadelphia, and Buffalo. The West has seven top-20 cities, five in California, but its 39 cities average only 48.7.
The table below ranks the 20 most walkable cities in the U.S. and Canada by Walk Score on a 0–100 scale:
| Rank | City | State/Province | Walk Score (Out of 100) |
|---|---|---|---|
| 1 | 🇺🇸 San Francisco | California | 88.7 |
| 2 | 🇺🇸 New York | New York | 88.0 |
| 3 | 🇺🇸 Jersey City | New Jersey | 86.6 |
| 4 | 🇺🇸 Boston | Massachusetts | 82.8 |
| 5 | 🇨🇦 Vancouver | British Columbia | 79.8 |
| 6 | 🇺🇸 Chicago | Illinois | 77.2 |
| 7 | 🇺🇸 Washington, DC | District of Columbia | 76.7 |
| 8 | 🇺🇸 Miami | Florida | 76.6 |
| 9 | 🇺🇸 Newark | New Jersey | 75.9 |
| 10 | 🇺🇸 Oakland | California | 75.3 |
| 11 | 🇺🇸 Philadelphia | Pennsylvania | 74.8 |
| 12 | 🇺🇸 Seattle | Washington | 74.4 |
| 13 | 🇺🇸 Long Beach | California | 73.3 |
| 14 | 🇺🇸 Minneapolis | Minnesota | 71.4 |
| 15 | 🇺🇸 Arlington | Virginia | 71.2 |
| 16 | 🇺🇸 Los Angeles | California | 68.6 |
| 17 | 🇺🇸 Hialeah | Florida | 67.9 |
| 18 | 🇺🇸 Portland | Oregon | 67.3 |
| 19 | 🇺🇸 Santa Ana | California | 67.1 |
| 20 | 🇺🇸 Buffalo | New York | 66.6 |
City limits help explain some of the surprising results. Walk Score rates roughly every block in a city, weighted by where people live, so a city whose borders contain mostly its dense urban core can score higher than one that stretches into the suburbs.
That’s how Jersey City (86.6) ranks third, ahead of Boston (82.8). It covers just 15 square miles of land across the Hudson River from Manhattan, about one-twentieth the area of New York City (300 square miles), according to Census Bureau data.
Six other smaller cities in major metropolitan areas also make the top 20: Newark, Oakland, Long Beach, Arlington, Hialeah, and Santa Ana. Los Angeles shows the reverse pattern. Its 469 square miles include much of the San Fernando Valley, and it ranks 16th (68.6), behind neighboring Long Beach (73.3).
Vancouver Is the Only Canadian City Among the 20 Most Walkable
Vancouver ranks fifth (79.8). Across all 22 Canadian cities in the ranking, the average Walk Score is 47.6, nearly identical to the 47.8 average for the 108 U.S. cities.
Transit is where Canadian cities pull ahead. They average a Transit Score of 51.8, compared with 36.0 for U.S. cities, and 17 of the 22 score higher on transit than on walkability. Among the 101 U.S. cities with a Transit Score, only New York and Charlotte do.
The table below shows the Walk Score of all 130 cities, along with their Transit Score and Bike Score:
| Rank | City | State/Province | Score (Out of 100) | ||
|---|---|---|---|---|---|
| Walk | Transit | Bike | |||
| 1 | 🇺🇸 San Francisco | California | 88.7 | 77.1 | 72.3 |
| 2 | 🇺🇸 New York | New York | 88.0 | 88.6 | 69.3 |
| 3 | 🇺🇸 Jersey City | New Jersey | 86.6 | 70.5 | 63.9 |
| 4 | 🇺🇸 Boston | Massachusetts | 82.8 | 72.4 | 69.4 |
| 5 | 🇨🇦 Vancouver | British Columbia | 79.8 | 74.4 | 78.9 |
| 6 | 🇺🇸 Chicago | Illinois | 77.2 | 65.0 | 72.2 |
| 7 | 🇺🇸 Washington, DC | District of Columbia | 76.7 | 68.7 | 69.5 |
| 8 | 🇺🇸 Miami | Florida | 76.6 | 57.0 | 64.0 |
| 9 | 🇺🇸 Newark | New Jersey | 75.9 | 65.0 | 51.1 |
| 10 | 🇺🇸 Oakland | California | 75.3 | 56.6 | 65.5 |
| 11 | 🇺🇸 Philadelphia | Pennsylvania | 74.8 | 67.0 | 66.7 |
| 12 | 🇺🇸 Seattle | Washington | 74.4 | 59.6 | 71.1 |
| 13 | 🇺🇸 Long Beach | California | 73.3 | 48.9 | 70.1 |
| 14 | 🇺🇸 Minneapolis | Minnesota | 71.4 | 55.0 | 83.5 |
| 15 | 🇺🇸 Arlington | Virginia | 71.2 | 58.6 | 72.3 |
| 16 | 🇺🇸 Los Angeles | California | 68.6 | 52.9 | 58.7 |
| 17 | 🇺🇸 Hialeah | Florida | 67.9 | 39.0 | 50.6 |
| 18 | 🇺🇸 Portland | Oregon | 67.3 | 49.3 | 82.7 |
| 19 | 🇺🇸 Santa Ana | California | 67.1 | 43.3 | 62.2 |
| 20 | 🇺🇸 Buffalo | New York | 66.6 | 47.5 | 62.8 |
| 21 | 🇺🇸 Honolulu | Hawaii | 65.7 | 56.3 | 51.0 |
| 21 | 🇺🇸 St. Louis | Missouri | 65.7 | 42.6 | 57.7 |
| 23 | 🇨🇦 Montréal | Quebec | 65.4 | 67.0 | 72.6 |
| 24 | 🇺🇸 Baltimore | Maryland | 64.3 | 53.2 | 53.4 |
| 25 | 🇺🇸 Pittsburgh | Pennsylvania | 62.4 | 55.2 | 54.9 |
| 26 | 🇺🇸 Milwaukee | Wisconsin | 61.5 | 48.7 | 57.6 |
| 27 | 🇺🇸 Denver | Colorado | 61.2 | 44.6 | 71.8 |
| 28 | 🇨🇦 Toronto | Ontario | 61.0 | 78.2 | 61.0 |
| 29 | 🇺🇸 Rochester | New York | 60.7 | 41.3 | 59.9 |
| 30 | 🇺🇸 St. Paul | Minnesota | 60.4 | 46.4 | 64.0 |
| 31 | 🇨🇦 Burnaby | British Columbia | 60.1 | 66.8 | 59.5 |
| 32 | 🇺🇸 New Orleans | Louisiana | 58.0 | 43.9 | 65.7 |
| 33 | 🇺🇸 Cleveland | Ohio | 57.1 | 43.9 | 52.3 |
| 34 | 🇺🇸 Anaheim | California | 55.7 | 33.9 | 52.3 |
| 35 | 🇨🇦 Longueuil | Quebec | 54.4 | 52.5 | 69.6 |
| 36 | 🇺🇸 San Diego | California | 53.3 | 37.3 | 43.0 |
| 37 | 🇺🇸 Detroit | Michigan | 51.1 | 35.7 | 52.1 |
| 38 | 🇺🇸 Richmond | Virginia | 50.9 | 50.8 | |
| 39 | 🇺🇸 San Jose | California | 50.5 | 40.1 | 61.5 |
| 40 | 🇺🇸 Paradise | Nevada | 50.1 | 38.1 | 50.1 |
| 41 | 🇺🇸 Fremont | California | 49.9 | 36.3 | 54.4 |
| 42 | 🇺🇸 Madison | Wisconsin | 49.7 | 34.9 | 65.5 |
| 43 | 🇨🇦 Hamilton | Ontario | 49.6 | 45.4 | 50.3 |
| 44 | 🇺🇸 Tampa | Florida | 49.5 | 31.3 | 55.2 |
| 45 | 🇺🇸 Spokane | Washington | 49.2 | 36.0 | 52.1 |
| 46 | 🇺🇸 Cincinnati | Ohio | 49.1 | 44.1 | 35.6 |
| 47 | 🇺🇸 Sacramento | California | 49.0 | 33.9 | 66.9 |
| 48 | 🇨🇦 Mississauga | Ontario | 48.9 | 56.0 | 54.1 |
| 49 | 🇨🇦 Winnipeg | Manitoba | 48.5 | 51.2 | 61.1 |
| 50 | 🇺🇸 Omaha | Nebraska | 48.2 | 24.0 | 41.7 |
| 51 | 🇺🇸 Atlanta | Georgia | 47.7 | 43.7 | 41.7 |
| 52 | 🇺🇸 Houston | Texas | 47.5 | 36.2 | 48.6 |
| 53 | 🇺🇸 Fresno | California | 46.6 | 33.1 | 58.1 |
| 54 | 🇺🇸 Toledo | Ohio | 46.4 | 45.6 | |
| 55 | 🇨🇦 Surrey | British Columbia | 46.1 | 47.1 | 55.9 |
| 56 | 🇺🇸 Dallas | Texas | 46.0 | 38.9 | 49.3 |
| 57 | 🇺🇸 Norfolk | Virginia | 45.8 | 35.7 | 46.9 |
| 58 | 🇨🇦 Saskatoon | Saskatchewan | 45.7 | 45.0 | 31.7 |
| 59 | 🇺🇸 Chula Vista | California | 45.6 | 35.4 | 41.2 |
| 60 | 🇨🇦 Ottawa | Ontario | 45.1 | 49.5 | 63.6 |
| 61 | 🇺🇸 San Bernardino | California | 45.0 | 30.9 | 43.6 |
| 61 | 🇺🇸 Des Moines | Iowa | 45.0 | 30.1 | 39.4 |
| 63 | 🇺🇸 Irving | Texas | 44.8 | 28.7 | 42.0 |
| 64 | 🇨🇦 Kitchener | Ontario | 44.6 | 46.8 | 54.9 |
| 64 | 🇨🇦 Québec | Quebec | 44.6 | 46.9 | 59.3 |
| 66 | 🇺🇸 Lincoln | Nebraska | 44.1 | 24.3 | 58.5 |
| 67 | 🇺🇸 Stockton | California | 43.7 | 25.4 | 52.4 |
| 68 | 🇺🇸 Tucson | Arizona | 43.2 | 34.5 | 66.3 |
| 68 | 🇺🇸 Irvine | California | 43.2 | 25.7 | 69.5 |
| 70 | 🇨🇦 Laval | Quebec | 43.1 | 46.3 | 57.3 |
| 71 | 🇺🇸 St. Petersburg | Florida | 43.0 | 33.5 | 58.5 |
| 72 | 🇺🇸 Riverside | California | 42.7 | 29.9 | 48.9 |
| 73 | 🇺🇸 Albuquerque | New Mexico | 42.6 | 28.6 | 60.9 |
| 74 | 🇺🇸 Aurora | Colorado | 42.5 | 35.2 | 53.3 |
| 74 | 🇨🇦 Brampton | Ontario | 42.5 | 53.3 | 54.8 |
| 76 | 🇨🇦 Windsor | Ontario | 42.4 | 37.9 | 52.3 |
| 77 | 🇺🇸 Las Vegas | Nevada | 42.0 | 35.5 | 46.5 |
| 78 | 🇺🇸 Austin | Texas | 41.7 | 34.8 | 54.0 |
| 79 | 🇺🇸 Phoenix | Arizona | 41.4 | 35.6 | 55.9 |
| 80 | 🇺🇸 Columbus | Ohio | 41.2 | 30.2 | 47.7 |
| 81 | 🇺🇸 Orlando | Florida | 41.1 | 32.7 | 56.8 |
| 82 | 🇺🇸 Plano | Texas | 40.5 | 14.8 | 52.0 |
| 83 | 🇺🇸 El Paso | Texas | 40.4 | 28.0 | 42.0 |
| 84 | 🇺🇸 Corpus Christi | Texas | 40.3 | 26.6 | 42.1 |
| 85 | 🇺🇸 Garland | Texas | 40.2 | 29.2 | 40.6 |
| 85 | 🇺🇸 Glendale | Arizona | 40.2 | 33.5 | 56.5 |
| 85 | 🇺🇸 Reno | Nevada | 40.2 | 24.2 | 52.0 |
| 85 | 🇨🇦 Edmonton | Alberta | 40.2 | 48.6 | 39.5 |
| 89 | 🇺🇸 Baton Rouge | Louisiana | 39.1 | 44.3 | |
| 89 | 🇨🇦 Calgary | Alberta | 39.1 | 49.5 | 50.1 |
| 91 | 🇺🇸 Tulsa | Oklahoma | 39.0 | 22.7 | 47.2 |
| 91 | 🇺🇸 Lubbock | Texas | 39.0 | 20.6 | 42.5 |
| 93 | 🇨🇦 London | Ontario | 38.6 | 45.0 | 52.8 |
| 94 | 🇺🇸 Boise | Idaho | 38.5 | 22.6 | 62.3 |
| 95 | 🇺🇸 Arlington | Texas | 38.1 | 0.3 | 39.5 |
| 96 | 🇺🇸 Mesa | Arizona | 37.9 | 27.0 | 59.6 |
| 97 | 🇨🇦 Gatineau | Quebec | 37.4 | 40.8 | 57.6 |
| 98 | 🇺🇸 Bakersfield | California | 37.3 | 24.6 | 43.7 |
| 99 | 🇺🇸 San Antonio | Texas | 36.9 | 30.9 | 44.5 |
| 100 | 🇺🇸 Laredo | Texas | 36.8 | 39.6 | |
| 101 | 🇺🇸 Colorado Springs | Colorado | 36.1 | 18.8 | 44.7 |
| 102 | 🇺🇸 Chandler | Arizona | 35.4 | 24.4 | 55.4 |
| 103 | 🇺🇸 Kansas City | Missouri | 35.3 | 25.5 | 35.0 |
| 104 | 🇺🇸 Memphis | Tennessee | 35.0 | 22.2 | 41.2 |
| 105 | 🇺🇸 Fort Worth | Texas | 34.9 | 21.6 | 38.6 |
| 106 | 🇺🇸 Wichita | Kansas | 34.8 | 19.7 | 43.9 |
| 106 | 🇨🇦 Vaughan | Ontario | 34.8 | 42.8 | 44.3 |
| 108 | 🇨🇦 Markham | Ontario | 34.5 | 49.3 | 46.8 |
| 109 | 🇺🇸 Louisville | Kentucky | 34.3 | 27.3 | 43.3 |
| 109 | 🇺🇸 Lexington-Fayette | Kentucky | 34.3 | 26.6 | 45.7 |
| 111 | 🇺🇸 Oklahoma City | Oklahoma | 34.1 | 16.9 | 40.2 |
| 112 | 🇺🇸 North Las Vegas | Nevada | 33.7 | 33.3 | 48.5 |
| 113 | 🇺🇸 Birmingham | Alabama | 33.2 | 21.5 | 30.7 |
| 114 | 🇺🇸 Virginia Beach | Virginia | 33.1 | 20.7 | 41.7 |
| 115 | 🇺🇸 Scottsdale | Arizona | 31.9 | 23.3 | 56.4 |
| 116 | 🇺🇸 Fort Wayne | Indiana | 31.7 | 21.7 | 41.0 |
| 117 | 🇺🇸 Raleigh | North Carolina | 31.3 | 29.4 | 39.3 |
| 118 | 🇺🇸 Indianapolis | Indiana | 31.0 | 24.9 | 42.8 |
| 119 | 🇺🇸 Anchorage | Alaska | 30.9 | 21.6 | 51.8 |
| 120 | 🇺🇸 Durham | North Carolina | 30.3 | 27.5 | 37.6 |
| 121 | 🇺🇸 Henderson | Nevada | 30.0 | 24.6 | 43.5 |
| 122 | 🇺🇸 Greensboro | North Carolina | 29.4 | 32.2 | |
| 123 | 🇺🇸 Gilbert | Arizona | 29.0 | 15.1 | 52.6 |
| 124 | 🇺🇸 Nashville | Tennessee | 28.8 | 21.7 | 29.7 |
| 125 | 🇺🇸 Charlotte | North Carolina | 26.4 | 27.4 | 31.3 |
| 126 | 🇺🇸 Montgomery | Alabama | 25.8 | 16.4 | 32.9 |
| 127 | 🇺🇸 Jacksonville | Florida | 25.6 | 20.8 | 40.5 |
| 128 | 🇺🇸 Winston-Salem | North Carolina | 22.5 | 29.2 | |
| 129 | 🇺🇸 Fayetteville | North Carolina | 21.4 | 29.7 | |
| 130 | 🇺🇸 Chesapeake | Virginia | 21.3 | 13.9 | 34.7 |
One notable omission from the top 20 is Toronto. Its Transit Score of 78.2 is second only to New York’s (88.6), yet its Walk Score of 61.0 ranks 28th, below Buffalo (66.6) and Pittsburgh (62.4).
City boundaries help explain the difference. Toronto’s current borders date to a 1998 merger that combined the old City of Toronto with five neighboring municipalities, including the postwar suburbs of North York, Scarborough, and Etobicoke. Its score now blends downtown’s dense streets with suburban neighborhoods laid out for driving, all served by the same subway and bus network.
The same split appears in the suburbs north of Toronto. Markham (34.5) and Vaughan (34.8) both rank among the 25 least walkable cities, yet Markham’s Transit Score of 49.3 is higher than that of all but 17 of the 101 U.S. cities.
The Least Walkable Cities in the U.S. Are Mostly in the South
Southern cities average a Walk Score of 41.0 and account for 13 of the 20 least walkable cities, including eight of the bottom 10.
Chesapeake, Virginia (21.3), Fayetteville, North Carolina (21.4), and Winston-Salem, North Carolina (22.5) rank last. They’re the only three cities scoring below 25, a range where almost all errands require a car.
Many of these cities have expansive boundaries. Chesapeake was created in 1963 when the small city of South Norfolk merged with what remained of Norfolk County, and it now covers 338 square miles of land. Jacksonville (25.6) and Nashville (28.8), also in the bottom 10, merged with their surrounding counties in 1968 and 1963, respectively.
North Carolina’s six cities in the ranking all fall in the bottom 14, from Raleigh (31.3) down to Fayetteville. From 1959 until 2011, state law let cities annex neighboring areas without the consent of landowners there. Charlotte (26.4) now covers 308 square miles of land, more than New York City (300).
Low walkability can have financial consequences for residents who depend on cars for everyday trips. Among households with auto loans, car ownership costs amount to 18.8% of median household income in Alabama and 17.8% in Florida, compared with 10.6% in Massachusetts, home to fourth-ranked Boston.
While these figures reflect statewide costs rather than individual cities, they highlight the broader financial importance of transportation options.
Learn More on the Voronoi App
If you enjoyed today’s post, check out the global cities residents rate as most walkable on Voronoi.
Ranked: The 15 Best Colleges in America for 2027
Explore the best colleges in America for 2027, according to Forbes. MIT leads the ranking, with six Ivy League schools in the top 15.


What are the Best Colleges in America for 2027?
Key Takeaways
- MIT ranks first on Forbes’ 2027 list of America’s top colleges for the second consecutive year.
- Six of the eight Ivy League schools appear in the top 15.
- California has four institutions in the top 15, including the only two public universities on the list.
MIT has retained its position as America’s top-ranked college, but some of the biggest stories in this year’s ranking come from institutions outside the Ivy League.
This visualization ranks the 15 best colleges in America from Forbes’ 2027 Top Colleges ranking, which evaluates 500 colleges and universities based on student outcomes, including earnings, debt, graduation rates, and academic success.
Which Colleges Made the Top Five?
Princeton and Harvard follow MIT in second and third place, respectively, while Columbia and the University of Pennsylvania round out the top five.
The table below shows all 15 institutions, along with their home states and whether they are public or private.
| Rank | Name | State | Type |
|---|---|---|---|
| 1 | Massachusetts Institute of Technology | MA | Private not for profit |
| 2 | Princeton University | NJ | Private not for profit |
| 3 | Harvard University | MA | Private not for profit |
| 4 | Columbia University | NY | Private not for profit |
| 5 | University of Pennsylvania | PA | Private not for profit |
| 6 | Stanford University | CA | Private not for profit |
| 7 | California Institute of Technology | CA | Private not for profit |
| 8 | Yale University | CT | Private not for profit |
| 9 | University of California, Berkeley | CA | Public |
| 10 | Vanderbilt University | TN | Private not for profit |
| 11 | Johns Hopkins University | MD | Private not for profit |
| 12 | University of California, Los Angeles | CA | Public |
| 13 | Duke University | NC | Private not for profit |
| 14 | Cornell University | NY | Private not for profit |
| 15 | Northwestern University | IL | Private not for profit |
Unlike rankings that emphasize reputation, Forbes focuses on what students achieve during and after college. Alumni salaries account for 20% of the overall score, while student debt, graduation rates, return on investment, retention, academic success, and alumni leadership make up the rest.
One of the biggest movers was Caltech, which surged 17 places from 24th to seventh. According to Forbes, the California institution also has the highest share of graduates who go on to earn PhDs.
Six Ivy League Schools Make the Top 15
Princeton, Harvard, Columbia, Penn, Yale, and Cornell all appear in the top 15. Brown and Dartmouth are the only two Ivy League schools outside the group.
However, several non-Ivy League institutions also rank near the top. MIT leads the list, while Stanford and Caltech place among the top seven, highlighting the strength of some of America’s top non-Ivy League universities.
The results highlight how elite science and technology institutions compete alongside the Ivy League’s most prestigious universities.
California Has Four of 15 Best Colleges in America
California accounts for four institutions in the top 15: Stanford, Caltech, UC Berkeley, and UCLA.
Berkeley ranks ninth and UCLA 12th, making them the only two public universities among the 15 schools shown. The other 13 institutions are private.
California’s strong showing reflects its distinctive mix of elite private institutions and highly ranked public research universities.
For another perspective on college outcomes, see how these same institutions compare when ranked by alumni salary instead of Forbes’ overall score.
Learn More on the Voronoi App
If you enjoyed this visualization, check out The Best Non-U.S. Universities in 2025, Ranked on the Voronoi app.
-
 Countries3 weeks ago
Ranked: The World’s Best Countries at Math in 2026
-
Debt3 weeks ago
Ranked: Countries With the Most Government Debt Per Person
-
Jobs2 weeks ago
Mapped: The Best Employer in Every U.S. State
-
Cost of Living3 days ago
Ranked: The World’s Best Cities for Quality of Life in 2026
-
Maps1 week ago
Mapped: Every State’s Signature Ice Cream Flavor
-
GDP2 weeks ago
Ranked: The World’s Most and Least Taxed Countries
-
Economy6 days ago
Ranked: The World’s Richest Countries (2006-2026)
-
Economy3 weeks ago
Ranked: The World’s Strongest City Economies by 2050


