Lambda integrates with AWS X-Ray to help you trace, debug, and optimize Lambda applications. You can use X-Ray
to trace a request as it traverses resources in your application, which may include Lambda functions and other AWS
services.
To send tracing data to X-Ray, you can use one of two SDK libraries:
Each of the SDKs offer ways to send your telemetry data to the X-Ray service.
You can then use X-Ray to view, filter, and gain insights into your application's performance metrics to identify
issues and opportunities for optimization.
Important
The X-Ray and Powertools for AWS Lambda SDKs are part of a tightly integrated instrumentation solution offered by AWS.
The ADOT Lambda Layers are part of an industry-wide standard for tracing instrumentation that collect more data in general, but may not be
suited for all use cases. You can implement end-to-end tracing in X-Ray using either solution. To learn more about choosing between them, see
Choosing between the AWS
Distro for Open Telemetry and X-Ray SDKs.
Using Powertools for AWS Lambda (Java) and AWS SAM for tracing
Follow the steps below to download, build, and deploy a sample Hello World Java application with integrated Powertools for AWS Lambda (Java) modules using the AWS SAM. This application implements a
basic API backend and uses Powertools for emitting logs, metrics, and traces. It consists of an Amazon API Gateway endpoint and a Lambda function.
When you send a GET request to the API Gateway endpoint, the Lambda function invokes, sends logs and metrics using Embedded Metric Format to CloudWatch, and
sends traces to AWS X-Ray. The function returns a hello world message.
Prerequisites
To complete the steps in this section, you must have the following:
Initialize the application using the Hello World Java template.
sam init --app-template hello-world-powertools-java --name sam-app --package-type Zip --runtime java11 --no-tracing
Build the app.
cd sam-app && sam build
Deploy the app.
sam deploy --guided
Follow the on-screen prompts. To accept the default options provided in the interactive experience, press Enter.
Note
For HelloWorldFunction may not have authorization defined, Is this okay?, make sure to enter y.
Get the URL of the deployed application:
aws cloudformation describe-stacks --stack-name sam-app --query 'Stacks[0].Outputs[?OutputKey==`HelloWorldApi`].OutputValue' --output text
Invoke the API endpoint:
curl -X GET
If successful, you'll see this response:
{"message":"hello world"}
To get the traces for the function, run sam traces.
sam traces
The trace output looks like this:
New XRay Service Graph
  Start time: 2025-02-03 14:31:48+01:00
  End time: 2025-02-03 14:31:48+01:00
  Reference Id: 0 - (Root) AWS::Lambda - sam-app-HelloWorldFunction-y9Iu1FLJJBGD - Edges: []
   Summary_statistics:
     - total requests: 1
     - ok count(2XX): 1
     - error count(4XX): 0
     - fault count(5XX): 0
     - total response time: 5.587
  Reference Id: 1 - client - sam-app-HelloWorldFunction-y9Iu1FLJJBGD - Edges: [0]
   Summary_statistics:
     - total requests: 0
     - ok count(2XX): 0
     - error count(4XX): 0
     - fault count(5XX): 0
     - total response time: 0

XRay Event [revision 3] at (2025-02-03T14:31:48.500000) with id (1-63dd0cc4-3c869dec72a586875da39777) and duration (5.603s)
 - 5.587s - sam-app-HelloWorldFunction-y9Iu1FLJJBGD [HTTP: 200]
 - 4.053s - sam-app-HelloWorldFunction-y9Iu1FLJJBGD
   - 1.181s - Initialization
   - 4.037s - Invocation
     - 1.981s - ## handleRequest
       - 1.840s - ## getPageContents
   - 0.000s - Overhead
This is a public API endpoint that is accessible over the internet. We recommend that you delete the endpoint after testing.
sam delete
Using Powertools for AWS Lambda (Java) and the AWS CDK for tracing
Follow the steps below to download, build, and deploy a sample Hello World Java application with integrated Powertools for AWS Lambda (Java) modules using the AWS CDK. This application implements a
basic API backend and uses Powertools for emitting logs, metrics, and traces. It consists of an Amazon API Gateway endpoint and a Lambda function.
When you send a GET request to the API Gateway endpoint, the Lambda function invokes, sends logs and metrics using Embedded Metric Format to CloudWatch, and
sends traces to AWS X-Ray. The function returns a hello world message.
Prerequisites
To complete the steps in this section, you must have the following:
Create a project directory for your new application.
mkdir hello-world
cd hello-world
Initialize the app.
cdk init app --language java
Create a maven project with the following command:
mkdir app
cd app
mvn archetype:generate -DgroupId=helloworld -DartifactId=Function -DarchetypeArtifactId=maven-archetype-quickstart -DinteractiveMode=false
Open pom.xml in the hello-world\app\Function directory and replace the existing code with the following code that includes dependencies and maven plugins for Powertools.
Create the hello-world\app\src\main\resource directory and create log4j.xml for the log configuration.
mkdir -p src/main/resource
cd src/main/resource
touch log4j.xml
Open log4j.xml and add the following code.
Open App.java from the hello-world\app\Function\src\main\java\helloworld directory and replace the existing code with the following code.
This is the code for the Lambda function.
Open HelloWorldStack.java from the hello-world\src\main\java\com\myorg directory and replace the existing code with the following code. This code uses
Lambda Constructorand the
ApiGatewayv2 Constructor
to create a REST API and a Lambda function.
package com.myorg;

import software.amazon.awscdk.*;
import software.amazon.awscdk.services.apigatewayv2.alpha.*;
import software.amazon.awscdk.services.apigatewayv2.integrations.alpha.HttpLambdaIntegration;
import software.amazon.awscdk.services.apigatewayv2.integrations.alpha.HttpLambdaIntegrationProps;
import software.amazon.awscdk.services.lambda.Code;
import software.amazon.awscdk.services.lambda.Function;
import software.amazon.awscdk.services.lambda.FunctionProps;
import software.amazon.awscdk.services.lambda.Runtime;
import software.amazon.awscdk.services.lambda.Tracing;
import software.amazon.awscdk.services.logs.RetentionDays;
import software.amazon.awscdk.services.s3.assets.AssetOptions;
import software.constructs.Construct;

import java.util.Arrays;
import java.util.List;

import static java.util.Collections.singletonList;
import static software.amazon.awscdk.BundlingOutput.ARCHIVED;

public class HelloWorldStack extends Stack {
    public HelloWorldStack(final Construct scope, final String id) {
        this(scope, id, null);
    }

    public HelloWorldStack(final Construct scope, final String id, final StackProps props) {
        super(scope, id, props);

        List functionPackagingInstructions = Arrays.asList(
                "/bin/sh",
                "-c",
                "cd Function " +
                        "&& mvn clean install " +
                        "&& cp /asset-input/Function/target/function.jar /asset-output/"
        );
        BundlingOptions.Builder builderOptions = BundlingOptions.builder()
                .command(functionPackagingInstructions)
                .image(Runtime.JAVA_11.getBundlingImage())
                .volumes(singletonList(
                        // Mount local .m2 repo to avoid download all the dependencies again inside the container
                        DockerVolume.builder()
                                .hostPath(System.getProperty("user.home") + "/.m2/")
                                .containerPath("/root/.m2/")
                                .build()
                ))
                .user("root")
                .outputType(ARCHIVED);

        Function function = new Function(this, "Function", FunctionProps.builder()
                .runtime(Runtime.JAVA_11)
                .code(Code.fromAsset("app", AssetOptions.builder()
                        .bundling(builderOptions
                                .command(functionPackagingInstructions)
                                .build())
                        .build()))
                .handler("helloworld.App::handleRequest")
                .memorySize(1024)
                .tracing(Tracing.ACTIVE)
                .timeout(Duration.seconds(10))
                .logRetention(RetentionDays.ONE_WEEK)
                .build());

        HttpApi httpApi = new HttpApi(this, "sample-api", HttpApiProps.builder()
                .apiName("sample-api")
                .build());

        httpApi.addRoutes(AddRoutesOptions.builder()
                .path("/")
                .methods(singletonList(HttpMethod.GET))
                .integration(new HttpLambdaIntegration("function", function, HttpLambdaIntegrationProps.builder()
                        .payloadFormatVersion(PayloadFormatVersion.VERSION_2_0)
                        .build()))
                .build());

        new CfnOutput(this, "HttpApi", CfnOutputProps.builder()
                .description("Url for Http Api")
                .value(httpApi.getApiEndpoint())
                .build());
    }
}
Open pom.xml from the hello-world directory and replace the existing code with the following code.
Make sure you're in the hello-world directory and deploy your application.
cdk deploy
Get the URL of the deployed application:
aws cloudformation describe-stacks --stack-name HelloWorldStack --query 'Stacks[0].Outputs[?OutputKey==`HttpApi`].OutputValue' --output text
Invoke the API endpoint:
curl -X GET
If successful, you'll see this response:
{"message":"hello world"}
To get the traces for the function, run sam traces.
sam traces
The trace output looks like this:
New XRay Service Graph
  Start time: 2025-02-03 14:59:50+00:00
  End time: 2025-02-03 14:59:50+00:00
  Reference Id: 0 - (Root) AWS::Lambda - sam-app-HelloWorldFunction-YBg8yfYtOc9j - Edges: [1]
   Summary_statistics:
     - total requests: 1
     - ok count(2XX): 1
     - error count(4XX): 0
     - fault count(5XX): 0
     - total response time: 0.924
  Reference Id: 1 - AWS::Lambda::Function - sam-app-HelloWorldFunction-YBg8yfYtOc9j - Edges: []
   Summary_statistics:
     - total requests: 1
     - ok count(2XX): 1
     - error count(4XX): 0
     - fault count(5XX): 0
     - total response time: 0.016
  Reference Id: 2 - client - sam-app-HelloWorldFunction-YBg8yfYtOc9j - Edges: [0]
   Summary_statistics:
     - total requests: 0
     - ok count(2XX): 0
     - error count(4XX): 0
     - fault count(5XX): 0
     - total response time: 0

XRay Event [revision 1] at (2025-02-03T14:59:50.204000) with id (1-63dd2166-434a12c22e1307ff2114f299) and duration (0.924s)
 - 0.924s - sam-app-HelloWorldFunction-YBg8yfYtOc9j [HTTP: 200]
 - 0.016s - sam-app-HelloWorldFunction-YBg8yfYtOc9j
   - 0.739s - Initialization
   - 0.016s - Invocation
     - 0.013s - ## lambda_handler
       - 0.000s - ## app.hello
   - 0.000s - Overhead
This is a public API endpoint that is accessible over the internet. We recommend that you delete the endpoint after testing.
cdk destroy
Using ADOT to instrument your Java functions
ADOT provides fully managed Lambda layers that package
everything you need to collect telemetry data using the OTel SDK. By consuming this layer, you can instrument your
Lambda functions without having to modify any function code. You can also configure your layer to do custom
initialization of OTel. For more information, see Custom configuration for the ADOT Collector on Lambda in the ADOT documentation.
For Java runtimes, you can choose between two layers to consume:
AWS managed Lambda layer for ADOT Java (Auto-instrumentation Agent)
– This layer automatically transforms your function code at startup to collect tracing data. For
detailed instructions on how to consume this layer together with the ADOT Java agent, see AWS Distro for
OpenTelemetry Lambda Support for Java (Auto-instrumentation Agent) in the ADOT
documentation.
AWS managed Lambda layer for ADOT Java – This layer also
provides built-in instrumentation for Lambda functions, but it requires a few manual code changes to initialize
the OTel SDK. For detailed instructions on how to consume this layer, see AWS Distro for OpenTelemetry
Lambda Support for Java in the ADOT documentation.
Using the X-Ray SDK to instrument your Java functions
To record data about calls that your function makes to other resources and services in your application, you
can add the X-Ray SDK for Java to your build configuration. The following example shows a Gradle build
configuration that includes the libraries that activate automatic instrumentation of AWS SDK for Java 2.x clients.
After you add the correct dependencies and make the necessary code changes, activate tracing in your
function's configuration through the Lambda console or the API.
Activating tracing with the Lambda console
To toggle active tracing on your Lambda function with the console, follow these steps:
Tracing mode is part of the version-specific configuration when you publish a version of your function.
You can't change the tracing mode on a published version.
Activating tracing with CloudFormation
To activate tracing on an AWS::Lambda::Function resource in an CloudFormation template, use the
TracingConfig property.
Your function needs permission to upload trace data to X-Ray. When you activate tracing in the Lambda
console, Lambda adds the required permissions to your function's execution role. Otherwise, add the AWSXRayDaemonWriteAccess policy to the execution role.
After you've configured active tracing, you can observe specific requests
through your application. The
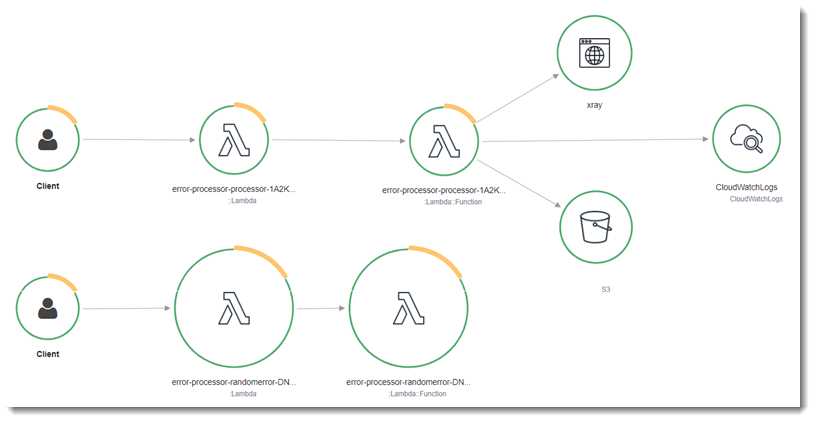
X-Ray service graph shows information about your application and all its components. The following example
shows an application with two functions.
The primary function processes events and sometimes returns errors. The second function at the top processes errors that appear
in the first's log group and uses the AWS SDK to call X-Ray, Amazon Simple Storage Service (Amazon S3), and Amazon CloudWatch Logs.
X-Ray doesn't trace all requests to your application. X-Ray applies a sampling algorithm
to ensure that tracing is efficient, while still providing a representative sample of all requests. The sampling rate is
1 request per second and 5 percent of additional requests. You can't configure the X-Ray sampling rate for your functions.
In X-Ray, a trace records information about a request that is processed by one or more
services. Lambda records 2 segments per trace, which creates
two nodes on the service graph. The following image highlights these two nodes:
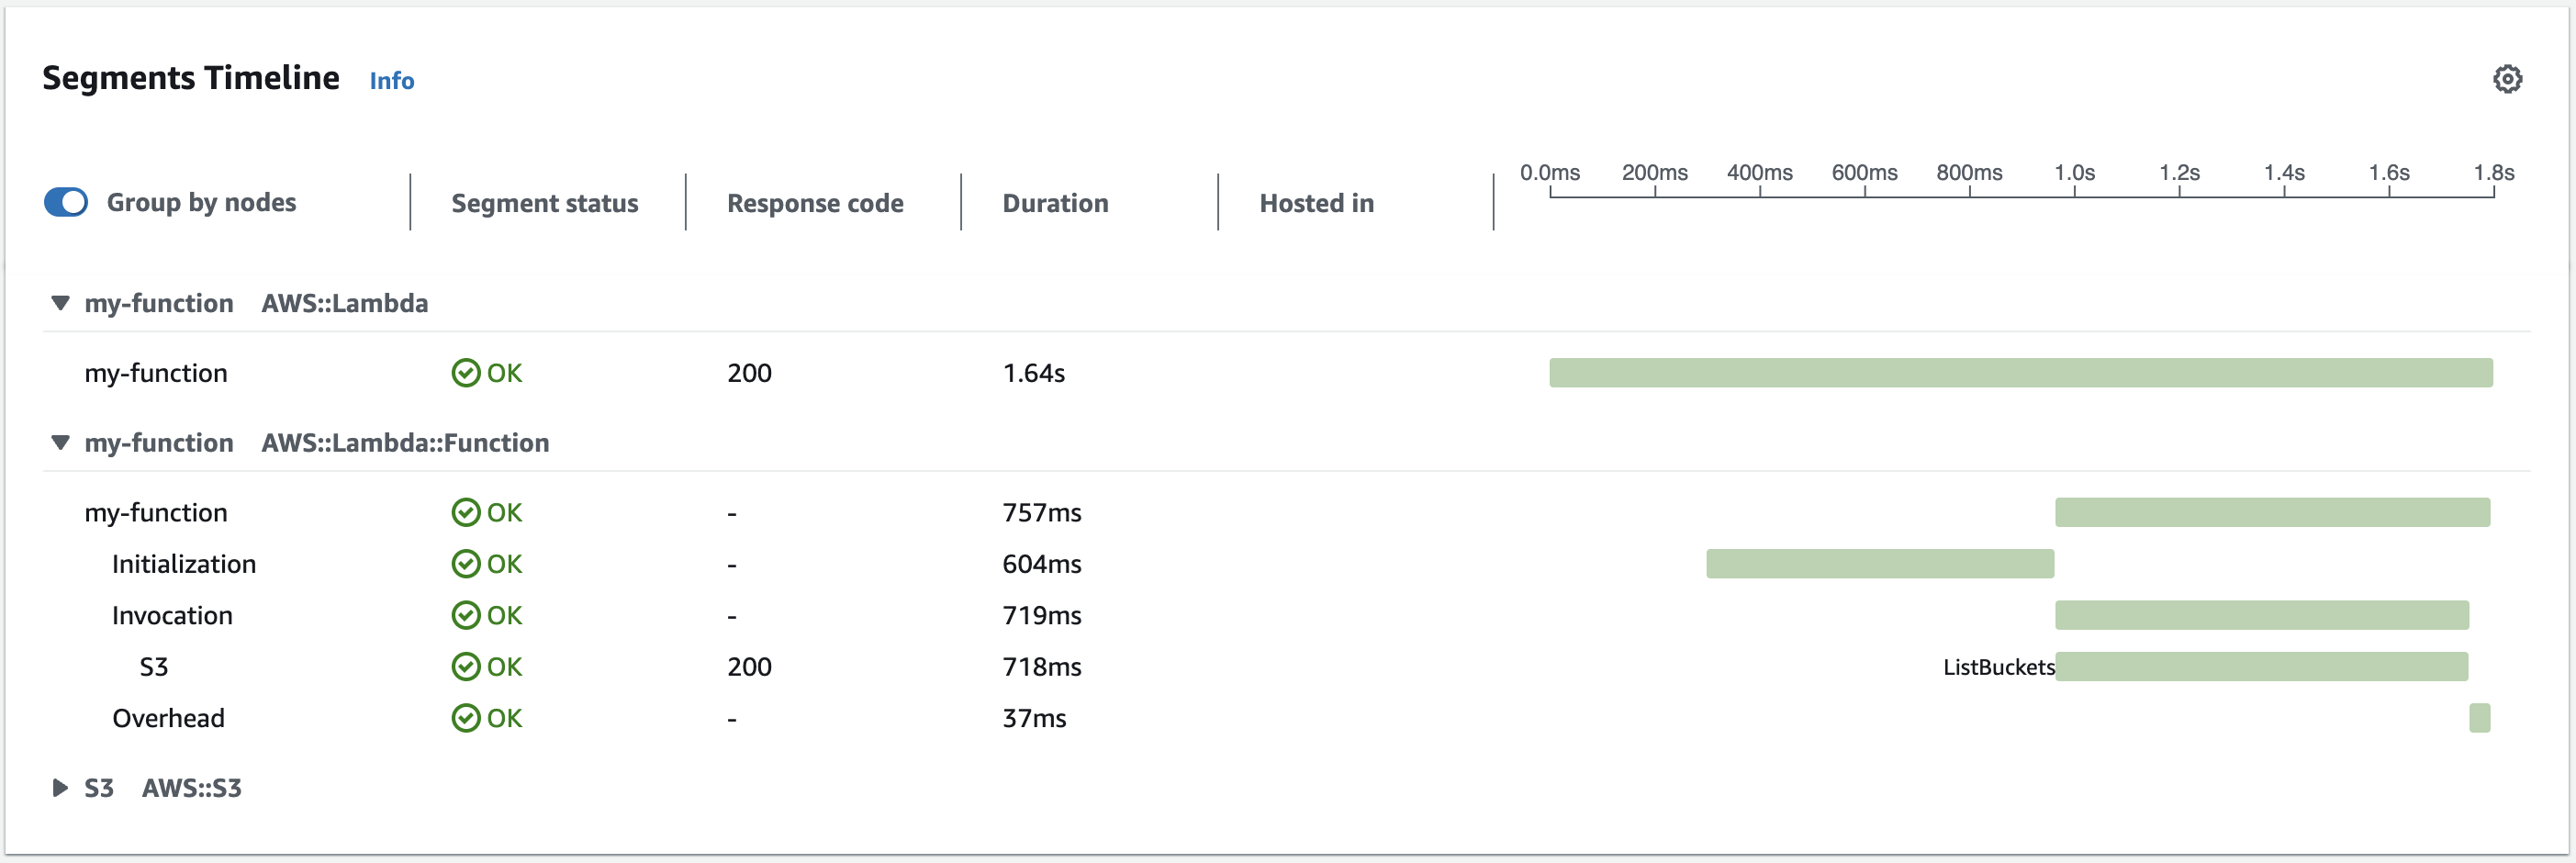
The first node on the left represents the Lambda service, which receives the invocation request. The second
node represents your specific Lambda function. The following example shows a trace with these two segments. Both
are named my-function, but one has an origin of AWS::Lambda and the other has
an origin of AWS::Lambda::Function. If the AWS::Lambda segment shows an error, the Lambda service had an issue. If the AWS::Lambda::Function segment shows an error, your function had an issue.
This example expands the AWS::Lambda::Function segment to show its three subsegments.
Note
AWS is currently implementing changes to the Lambda service. Due to these changes, you may see minor differences between the structure and content
of system log messages and trace segments emitted by different Lambda functions in your AWS account.
The example trace shown here illustrates the old-style function segment. The differences between the old- and new-style segments are described in the following paragraphs.
These changes will be implemented during the coming weeks, and all functions in all
AWS Regions except the China and GovCloud regions will transition to use the new-format log messages and trace segments.
The old-style function segment contains the following subsegments:
Initialization – Represents time spent loading your function and
running initialization code. This subsegment
only appears for the first event that each instance of your function processes.
Invocation – Represents the time spent running your handler code.
Overhead – Represents the time the Lambda runtime spends preparing
to handle the next event.
The new-style function segment doesn't contain an Invocation subsegment. Instead,
customer subsegments are attached directly to the function segment. For more information about the structure of the
old- and new-style function segments, see Understanding X-Ray traces.
Note
SnapStart functions also include a Restore subsegment. The Restore subsegment shows the time it takes for Lambda to restore a snapshot, load the runtime, and run any after-restore runtime hooks. The process of restoring snapshots can include time spent on activities outside the MicroVM. This time is reported in the Restore subsegment. You aren't charged for the time spent outside the microVM to restore a snapshot.
You can also instrument HTTP clients, record SQL queries, and create custom subsegments with annotations and
metadata. For more information, see AWS X-Ray SDK for Java in the AWS X-Ray Developer Guide.
Pricing
You can use X-Ray tracing for free each month up to a certain limit as part of the AWS Free Tier. Beyond that threshold, X-Ray charges for trace storage and
retrieval. For more information, see AWS X-Ray pricing.
Storing runtime dependencies in a layer (X-Ray SDK)
If you use the X-Ray SDK to instrument AWS SDK clients your function code, your deployment package can become
quite large. To avoid uploading runtime dependencies every time you update your function code, package the X-Ray SDK in a
Lambda layer.
The following example shows an AWS::Serverless::LayerVersion resource that stores the AWS SDK for Java
and X-Ray SDK for Java.
With this configuration, you update the library layer only if you change your runtime dependencies.
Since the function deployment package contains only your code, this can help reduce upload times.
Creating a layer for dependencies requires build configuration changes to generate the layer archive before
deployment. For a working example, see the java-basic sample
application on GitHub.
X-Ray tracing in sample applications (X-Ray SDK)
The GitHub repository for this guide includes sample applications that demonstrate the use of X-Ray tracing.
Each sample application includes scripts for easy deployment and cleanup, an AWS SAM template, and supporting
resources.
Sample Lambda applications in Java
example-java – A Java function that
demonstrates how you can use Lambda to process orders. This function illustrates how to define and
deserialize a custom input event object, use the AWS SDK, and output logging.
java-basic – A collection of minimal Java functions
with unit tests and variable logging configuration.
java-events – A collection of Java functions that
contain skeleton code for how to handle events from various services such as Amazon API Gateway, Amazon SQS, and Amazon Kinesis.
These functions use the latest version of the aws-lambda-java-events
library (3.0.0 and newer). These examples do not require the AWS SDK as a dependency.
s3-java – A Java function that processes
notification events from Amazon S3 and uses the Java Class Library (JCL) to create thumbnails from uploaded image
files.
layer-java – A Java function that illustrates
how to use a Lambda layer to package dependencies separate from your core function code.
All of the sample applications have active tracing enabled for Lambda functions. For example, the
s3-java application shows automatic instrumentation of AWS SDK for Java 2.x clients, segment
management for tests, custom subsegments, and the use of Lambda layers to store runtime dependencies.
Did this page help you? - Yes
Thanks for letting us know we're doing a good job!
If you've got a moment, please tell us what we did right so we can do more of it.
Did this page help you? - No
Thanks for letting us know this page needs work. We're sorry we let you down.
If you've got a moment, please tell us how we can make the documentation better.