Introduction to Correspondence Analysis Using R and Indonesia Real Dataset
Indonesian Creative Economy Agency 2016

Hands-on Tutorial
Leveraging Indonesia's creative economy
Background
The creative industry, as defined by Pahlevi (2017), encompasses a diverse range of human activities involving the creation, production, distribution, exchange, and consumption of goods and services with cultural, artistic, aesthetic, intellectual, and emotional value. This industry produces both tangible and intangible outputs that hold economic value through the exploration of cultural values and the production of science-based goods and services, including traditional and modern products.
Currently, the creative industry has been categorized into 16 subsectors, including game application and development, architectural and interior design, visual communication design, product design, fashion, film, animation video, photography, craft, culinary, music, publishing, advertising, performing arts, fine arts, television, and radio, each with its unique set of challenges. These subsectors exhibit distinctive characteristics that influence their development, and one key factor in fostering a thriving creative economy is how a city is positioned as a cultural and artistic hub.
In Indonesia, each province possesses its own potential for the development of creative industries, which vary from one another. This can be observed through the dominance of certain subsectors of the creative industry in specific provinces. Hence, conducting an in-depth analysis of the distribution characteristics of creative industry subsectors across Indonesian provinces becomes essential. Correspondence analysis, a visual approach similar to biplot analysis but tailored for categorical data in contingency tables, can be employed for this analysis. It provides visually appealing, informative, communicative, and artistic graphics that facilitate a better understanding of the data.
ObjectivesThe study aims to achieve the following objectives in a professional manner:
To identify and examine the relationships between variables within the creative industry subsectors in Indonesia, including game application and development, architectural and interior design, visual communication design, fashion, and others
To determine the relative positioning of provinces in order to identify similarities among them in Indonesia based on the creative industry subsectors
To explore and analyze the relationships between different creative industry subsectors, elucidating their interdependencies and potential synergies
To identify and highlight provinces in Indonesia that exhibit a lower number of creative industry subsectors in the year 2016, providing insights into potential areas for further development and intervention
These objectives reflect the systematic and rigorous approach of the study towards understanding the relationships and dynamics within the creative industry subsectors in Indonesia, with the ultimate goal of informing policies and strategies for fostering the growth and development of the creative economy in the country.
BenefitsThe study offers several significant benefits in a professional context:
Providing a comprehensive snapshot of the development of the creative industry in Indonesia in the year 2016, offering valuable insights into the current state and trends of this dynamic sector.
Offering an in-depth analysis of the development trend of creative industry subsectors in Indonesia in 2016, allowing for a better understanding of the evolving landscape and potential growth areas.
Serving as a valuable resource for the government's evaluation materials in formulating policies and strategies for the development of creative industries in each province of Indonesia, providing evidence-based insights and recommendations to inform decision-making processes.
These benefits highlight the relevance and potential impact of the study in contributing to the advancement of the creative economy in Indonesia, and its potential usefulness for policymakers, researchers, and stakeholders interested in the growth and sustainability of the creative industry sector in the country.
ScopesThe study is focused on the analysis of secondary data obtained from the official website of the Indonesian Creative Economy Agency. The data pertains to the distribution of creative industry subsectors in Indonesia in the year 2016. The study utilizes this data to conduct an in-depth analysis of the relationships between variables within the creative industry subsectors, as well as to identify the relative position of provinces and their similarities based on the creative industry subsector. The scope of the study is limited to the data available from the official source for the specific year mentioned, and the analysis is conducted using correspondence analysis as the analytical approach.
Methodology
DataThe data utilized in the study is sourced from secondary data on the distribution of the creative industry subsector in Indonesia for the year 2016, which was obtained from the official website of the Indonesian Creative Economy Agency. The dataset comprises several variables, including:

The procedure of data analysisThe research of correspondence analysis for the creative industry subsector in Indonesia in 2016 was conducted through the following steps:
Descriptive analysis: A contingency table was created to identify the number of creative industry subsectors in each province or region in Indonesia
Relationship analysis: The dependency between provincial variables and creative industry subsector variables was analyzed to explore the relationships between them
Correspondence analysis: The following steps were performed:
Creation of a row-based profile table and column-based profile table based on the contingency table from the previous step.
Calculation of the proportion of row and column inertia based on the row-based profile and column-based profile.
Calculation of singular value decomposition based on the previous results to display the coordinates of each provincial variable and creative industry subsector variable in a two-dimensional plot.
These steps were carried out to analyze the relationships and dependencies between variables in the creative industry subsector in Indonesia in 2016 using correspondence analysis.
Result and Discussion
Data pre-processing and integrationThe initial step in the research of correspondence analysis on the Indonesian Creative Economy Agency data in 2016 involved data pre-processing, which was carried out as follows:
Manipulation of province or region names: The names of provinces or regions in the Creative Economy Agency data in 2016 were manipulated by eliminating the words "Province" and "Island". Additionally, the names of provinces or regions were summarized for better analysis.
Selection of variables: The variables to be analyzed using correspondence analysis were carefully selected. The selected variables included: application and game developer; film, animation and video; visual communication design; photography; and television and radio.
These pre-processing steps were conducted to ensure that the data used in the correspondence analysis was appropriately prepared, with province or region names modified for consistency and the selection of relevant variables for the analysis.
Data explorationData exploration was conducted to obtain initial information on the Creative Economy Agency data in 2016, specifically focusing on the variables of application and game developer, visual communication design, film, animation and video, photography, and television and radio. This exploratory analysis aimed to gain insights into the distribution, patterns, and characteristics of these variables within the dataset. Various techniques, such as descriptive statistics, graphical representations, and data visualization, were utilized to thoroughly understand the data and identify any noteworthy trends or patterns. The findings from this data exploration phase laid the groundwork for further analysis using correspondence analysis to uncover relationships and dependencies between the variables and provinces or regions in Indonesia.

Based on the analysis depicted in Figure 1, it can be deduced that photography is the subsector with the most prominent presence in the creative industry, surpassing application and game developers, visual communication design, film, animation and video, and television and radio. From a visual perspective, it can be inferred that Sumatra is the province or region with the highest concentration of photography businesses or companies compared to other provinces or regions. However, upon closer examination, West Java, Central Java, and East Java emerge as the provinces with the largest number of photography businesses or companies across Indonesia. Additionally, it is noteworthy that application and game developers also exhibit substantial presence in various provinces or regions, particularly in West Java and East Java, which boast a significant number of application and game developer businesses or companies compared to other provinces in Indonesia.
Profile tableThe initial stage of the correspondence analysis entails a comprehensive examination of the row and column profiles. The primary objective is to discern the creative industry subsectors that are witnessing growth across provinces or regions in Indonesia in 2016, and to identify the provinces or regions with the most significant creative businesses or companies. The row profile and column profile are illustrated in Table 3 and Table 4, respectively.

The row profile in Table 3 indicates that the highest mass value is 0.6413, which corresponds to the photography subsector (X4). This value represents the mode for the data and suggests that photography is the creative business or company with the highest percentage compared to other subsectors. The presence of the photography subsector is observed in all provinces or regions, indicating that photography is likely to be thriving in Indonesia in 2016, particularly in Yogyakarta, DKI Jakarta, West Java, Central Java, East Java, Bali & NTT, Kalimantan, Sulawesi & Papua, and Sumatra.
On the other hand, in Banten, the application and game developer subsector (X1) has the highest percentage according to the row profile. This suggests that in Banten, the application and game developer subsector is a rapidly developing creative business or company.
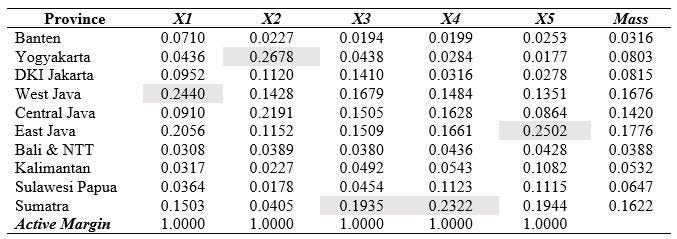
The column profile in Table 4 indicates that 17.76% of the creative industry subsector is located in East Java, 16.76% in West Java, and 16.22% in Sumatra. It can be observed that visual communication design is the subsector that appears to be developing in Yogyakarta in 2016, while applications and game developers tend to be developing in West Java. In East Java, television and radio subsectors tend to be developing, whereas in Sumatra, the film, animation, and video subsector, as well as the photography subsector, tend to be developing in 2016.
Chi-square StatisticsThe initial step in interpreting correspondence analysis is to assess if there is a statistically significant dependency between the rows and columns.
HypothesisH0: assumes that there is no association between the two variables H1: assumes that there is association between the two variables

Since the calculated P-value of 2.2e-16 is less than the significance level of 5% (α), the decision is to reject the null hypothesis. Thus, based on the Chi-Square test, it can be concluded that there is a significant association between the row and column categories at a significance level of 5%.
Correspondence analysisCorrespondence analysis is a multivariate analysis that utilizes the concept of Principal Component Analysis. To assess the variance, the calculation of eigenvalues is required. The eigenvalues for the correspondence analysis are presented in Table 5.

As per the findings in Table 5, Component 1 and Component 2 collectively account for 87.46415% of the variability observed in the data. This implies that the results obtained through correspondence analysis effectively capture a significant portion of the data's variability, signifying its reliability in explaining the data.

Upon examining the scree plot depicted in Figure 2 (a), it is evident that the percentage of variability explained by Component 2 experiences a sharp decline. This suggests that the inclusion of Component 3 does not significantly contribute to the explanatory power of the data. Hence, Component 1 and Component 2 are chosen as they effectively capture the data's variability. The combined total percentage of variability explained by these two selected components amounts to approximately 87.46415%.
Interpretations
The correspondence plot provides valuable insights into the grouping of provinces or regions in Indonesia based on the creative industry subsectors in 2016. The information extracted from the correspondence plot is as follows:
The first group comprises provinces or regions characterized by the creative industry subsectors of photography and television & radio. Provinces or regions falling within this group include Central Java, East Java, Bali & NTT, and Sulawesi & Papua.
The second group encompasses provinces or regions characterized by the creative industry subsectors of film, animation, video, as well as application and game development. Provinces or regions falling within this group are Banten, DKI Jakarta, and West Java.
The third group pertains to the province or region characterized by the creative industry subsector of visual communication design, which is Yogyakarta. This finding is further supported by the column profile, which exhibits the highest mass value for the visual communication design subsector originating from Yogyakarta province in comparison to other provinces.
For accessing the completed codes, kindly navigate to my GitHub repository at the multivariate repo. Thank you for your interest in reviewing the completed codes.
References
Anonim. Articles - Principal Component Methods in R: Practical Guide (2017), http://www.sthda.com/.
AS. Pahlevi. Gagasan Tentang Pengembangan Ekonomi Kreatif Nasional (Studi pada Potensi, Peluang dan Tantangan Ekonomi Kreatif di Kota Malang) (2017), Seminar Nasional Seni Dan Desain: "Membangun Tradisi Inovasi Melalui Riset Berbasis Praktik Seni Dan Desain" FBS Unesa.